Gold Analysis: Is this pullback temporary?
2026-03-25 01:55:16
On Tuesday (March 24), spot gold traded in a narrow range around $4,400 during the US session, with the latest price around $4,396, fluctuating between $4,305 and $4,448 during the day. Yesterday (March 23), gold prices retreated from their highs, testing support near $4,100 before rebounding, but failed to maintain this strength today, maintaining an overall slight pullback with a cumulative decline of approximately 0.63%.

Gold prices have recently retreated from their February high of around $5,600, breaking below the key support level of $4,500 and testing the 200-day moving average area of $4,000-$4,100, marking a significant pullback this year. Currently, gold prices have found initial buying support around $4,000-$4,100, showing a bullish reversal signal with a long lower shadow. However, significant resistance exists at $4,450-$4,500, indicating continued short-term pressure. Overall, the market is in a high-level consolidation phase, with risk aversion and profit-taking intertwined, resulting in active trading but unclear direction.
Fundamental analysis
The recent pullback in gold prices was mainly driven by two short-term pressures:
Liquidity constraints and physical gold selling pressure in the Gulf region: The Iranian blockade has led to a sharp decline in oil revenues for Gulf countries. To alleviate cash flow pressures, some sovereign wealth funds may sell their gold reserves, increasing physical supply in the market. This is a one-off liquidity event; once the blockade eases or reserve adjustments end, the selling pressure is expected to subside quickly and turn into restocking demand.
US Treasury yields are rising: The yield on the 10-year US Treasury note has broken through 4.3%, currently hovering in the 4.35%-4.39% range, approaching the next resistance level of 4.8%-5.0%. Higher yields increase the opportunity cost of holding gold, suppressing demand for non-interest-bearing assets.
However, the fundamentals are not entirely negative:
Inflation expectations triggered by energy prices: The ongoing conflict in the Middle East continues to push up oil prices, and the market has already priced in the energy inflation shock, which in turn provides long-term support for gold (inflation hedging property).
The US faces continued fiscal pressure: federal debt has reached $38.5 trillion, with a debt-to-GDP ratio of 122.5%, and the deficit for this fiscal year is projected to exceed $2 trillion. A vicious cycle is forming between tariff rebates, military spending, and rising debt servicing costs. The market anticipates that the Federal Reserve may be forced to intervene in long-term yields (fiscal-driven), which would lead to lower real yields and a weaker dollar, significantly benefiting gold.
US Dollar Index Performance: The DXY is currently around 99.3-99.4. Although it has rebounded, it has not yet broken through the key resistance of 100.50. If the dollar is blocked and falls back, the rebound momentum of gold prices will be strengthened.
Geopolitically, the signals from the US-Iran negotiations have been inconsistent (Trump postponed the strikes but Iran denied negotiating), and the market remains concerned about the protracted conflict. Safe-haven demand is appearing intermittently, but the expectation of "higher and longer" interest rates driven by oil prices has currently overshadowed the pure safe-haven logic.
Technical Analysis
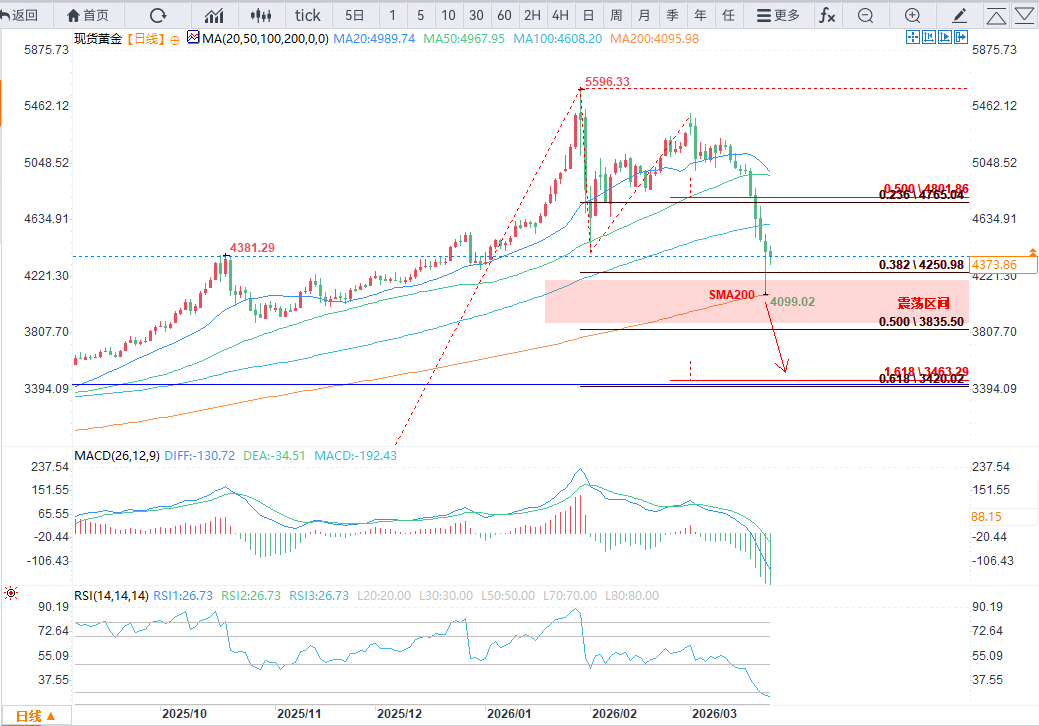
(Spot gold daily chart source: EasyForex)
Daily chart: Gold prices have broken below the key support zone of $4400-$4500, directly testing the 200-day moving average (around $4100). Yesterday's significant lower shadow indicates strong buying pressure in the $4000-$4100 area. As long as this support holds, the overall bullish trend (moving averages still trending upwards) remains intact; this is the largest pullback since 2024. A break above $4600 would confirm a bottom and open up further upside potential towards $5000.
4-hour chart: Short-term bearish, with prices trading within a downward channel, below the 50-period and 100-period SMAs. The RSI (14) hovers around 39 (below the 50 midline), and although the MACD has formed a golden cross, it remains at a low level. The current rebound lacks volume support, and sellers still have the upper hand.
Key technology positions:
Support levels: $4300 → $4098 (year low) → $4000 (200-day moving average)
Resistance: $4450-$4500 → $4795 (50-day moving average) → $5000 psychological level
Market Outlook
Over the next two weeks, gold prices are expected to continue trading within a range. If the $4,000 support level holds, coupled with the dollar index encountering resistance near 99.4, a rebound to test $4,600 is anticipated. However, if the dollar index breaks through 100.50 or yields continue to rise above 4.8%, a further decline below $4,000 is possible, leading to deeper consolidation.
Risk Warning
Upside risks: A decline in the US dollar index and an escalation of the US-Iran conflict could push up oil prices and inflation expectations.
Downside risks: Yields continue to break through 4.8%, Gulf sell-off extends, and the US dollar index rises above 100.50.
Unexpected events: Any new developments in US-Iran negotiations or speeches by Federal Reserve officials could trigger sharp fluctuations.
At 01:34 Beijing time, spot gold was trading at $4,386.05 per ounce, down 0.47%.
Gold prices have recently retreated from their February high of around $5,600, breaking below the key support level of $4,500 and testing the 200-day moving average area of $4,000-$4,100, marking a significant pullback this year. Currently, gold prices have found initial buying support around $4,000-$4,100, showing a bullish reversal signal with a long lower shadow. However, significant resistance exists at $4,450-$4,500, indicating continued short-term pressure. Overall, the market is in a high-level consolidation phase, with risk aversion and profit-taking intertwined, resulting in active trading but unclear direction.
Fundamental analysis
The recent pullback in gold prices was mainly driven by two short-term pressures:
Liquidity constraints and physical gold selling pressure in the Gulf region: The Iranian blockade has led to a sharp decline in oil revenues for Gulf countries. To alleviate cash flow pressures, some sovereign wealth funds may sell their gold reserves, increasing physical supply in the market. This is a one-off liquidity event; once the blockade eases or reserve adjustments end, the selling pressure is expected to subside quickly and turn into restocking demand.
US Treasury yields are rising: The yield on the 10-year US Treasury note has broken through 4.3%, currently hovering in the 4.35%-4.39% range, approaching the next resistance level of 4.8%-5.0%. Higher yields increase the opportunity cost of holding gold, suppressing demand for non-interest-bearing assets.
However, the fundamentals are not entirely negative:
Inflation expectations triggered by energy prices: The ongoing conflict in the Middle East continues to push up oil prices, and the market has already priced in the energy inflation shock, which in turn provides long-term support for gold (inflation hedging property).
The US faces continued fiscal pressure: federal debt has reached $38.5 trillion, with a debt-to-GDP ratio of 122.5%, and the deficit for this fiscal year is projected to exceed $2 trillion. A vicious cycle is forming between tariff rebates, military spending, and rising debt servicing costs. The market anticipates that the Federal Reserve may be forced to intervene in long-term yields (fiscal-driven), which would lead to lower real yields and a weaker dollar, significantly benefiting gold.
US Dollar Index Performance: The DXY is currently around 99.3-99.4. Although it has rebounded, it has not yet broken through the key resistance of 100.50. If the dollar is blocked and falls back, the rebound momentum of gold prices will be strengthened.
Geopolitically, the signals from the US-Iran negotiations have been inconsistent (Trump postponed the strikes but Iran denied negotiating), and the market remains concerned about the protracted conflict. Safe-haven demand is appearing intermittently, but the expectation of "higher and longer" interest rates driven by oil prices has currently overshadowed the pure safe-haven logic.
Technical Analysis
(Spot gold daily chart source: EasyForex)
Daily chart: Gold prices have broken below the key support zone of $4400-$4500, directly testing the 200-day moving average (around $4100). Yesterday's significant lower shadow indicates strong buying pressure in the $4000-$4100 area. As long as this support holds, the overall bullish trend (moving averages still trending upwards) remains intact; this is the largest pullback since 2024. A break above $4600 would confirm a bottom and open up further upside potential towards $5000.
4-hour chart: Short-term bearish, with prices trading within a downward channel, below the 50-period and 100-period SMAs. The RSI (14) hovers around 39 (below the 50 midline), and although the MACD has formed a golden cross, it remains at a low level. The current rebound lacks volume support, and sellers still have the upper hand.
Key technology positions:
Support levels: $4300 → $4098 (year low) → $4000 (200-day moving average)
Resistance: $4450-$4500 → $4795 (50-day moving average) → $5000 psychological level
Market Outlook
Over the next two weeks, gold prices are expected to continue trading within a range. If the $4,000 support level holds, coupled with the dollar index encountering resistance near 99.4, a rebound to test $4,600 is anticipated. However, if the dollar index breaks through 100.50 or yields continue to rise above 4.8%, a further decline below $4,000 is possible, leading to deeper consolidation.
Risk Warning
Upside risks: A decline in the US dollar index and an escalation of the US-Iran conflict could push up oil prices and inflation expectations.
Downside risks: Yields continue to break through 4.8%, Gulf sell-off extends, and the US dollar index rises above 100.50.
Unexpected events: Any new developments in US-Iran negotiations or speeches by Federal Reserve officials could trigger sharp fluctuations.
At 01:34 Beijing time, spot gold was trading at $4,386.05 per ounce, down 0.47%.
- Risk Warning and Disclaimer
- The market involves risk, and trading may not be suitable for all investors. This article is for reference only and does not constitute personal investment advice, nor does it take into account certain users’ specific investment objectives, financial situation, or other needs. Any investment decisions made based on this information are at your own risk.