While everyone is betting on a ceasefire in crude oil, the major players are ambushing in the US Treasury auction: Are you brave enough to follow this V-shaped rebound in gold?
2026-03-25 20:39:11
Entering late March 2026, global financial markets exhibited highly dramatic interconnectedness. Influenced by the latest developments in the Middle East, market risk aversion and growth concerns intertwined. Recently, due to the coexistence of tariff expectations and geopolitical maneuvering, while the US-proposed 15-point peace plan caused a significant discount in oil prices, the market remained cautious about its true prospects due to the strategic deployment of increased US troops to the Middle East.
On Wednesday (March 25), the 10-year US Treasury yield retreated from its highs, reflecting investors' reassessment of interest rate paths amid fluctuating inflation expectations. The US dollar index encountered resistance at higher levels and entered a narrow trading range, while spot gold, which had previously experienced a sharp correction, began a strong oversold rebound. Overall, the sharp decline in crude oil prices eased inflationary pressures in the short term, causing market bets on further Fed rate hikes to fall from 25% to around 16%. This change in the macroeconomic environment provided precious metals with a breather.
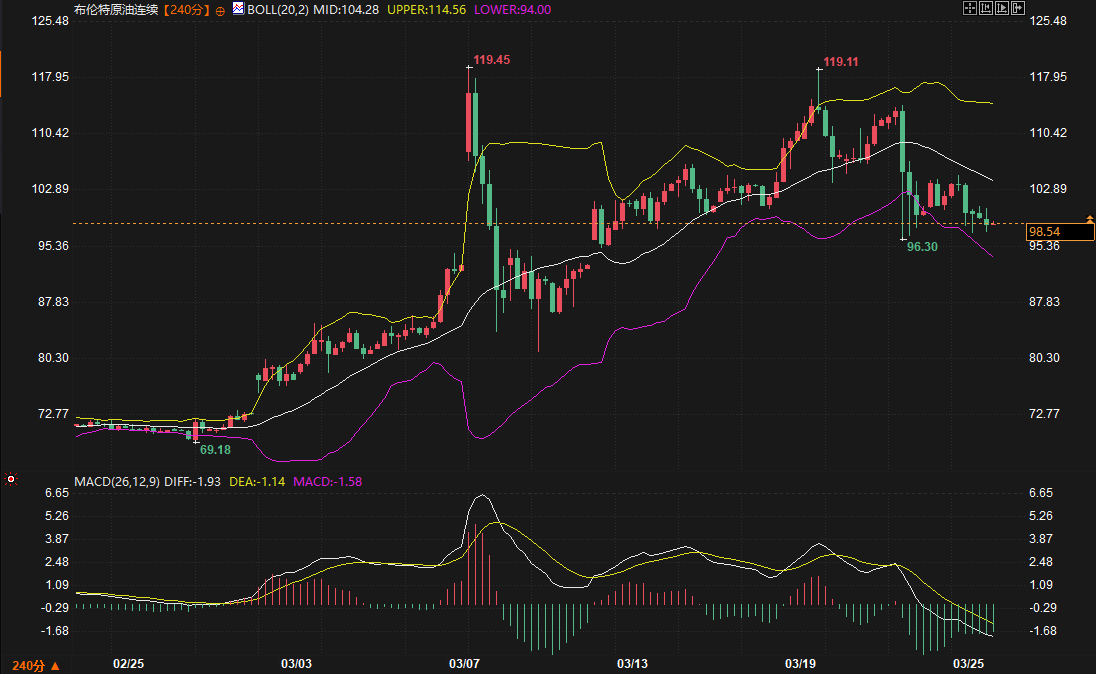
From a technical perspective, Brent crude oil has shown a clear double-top reversal pattern on the 4-hour chart. Previously, the price attempted to break through the $119 range twice, on March 7th and March 19th, but failed, subsequently initiating a significant decline. Currently, the price has fallen to around $98.54, effectively breaking below the $100 psychological level. The Bollinger Bands indicator shows that the price has moved below the middle band at $104.28 and continues to approach the lower band support area at $94.00.
Fundamentally, the sharp fluctuations in the crude oil market were primarily driven by the fading geopolitical premium. Analysts from well-known institutions pointed out that although the US has offered a peace plan on the diplomatic front, its potential threat to Iran's energy infrastructure remains a Damocles' sword hanging over the market. However, in the short term, the market is more inclined to trade on "ceasefire expectations," leading to a stampede of long positions exiting the market.
The MACD indicator shows that both the DIFF and DEA lines are trending downwards, with the green bars continuing to expand, indicating that the bearish momentum has not yet exhausted itself. In the next 2-3 trading days, the resistance level for crude oil is concentrated at 104.28 (Bollinger Band middle line). If this level cannot be recovered, the price will likely retest the support level in the 94.00-96.30 range.
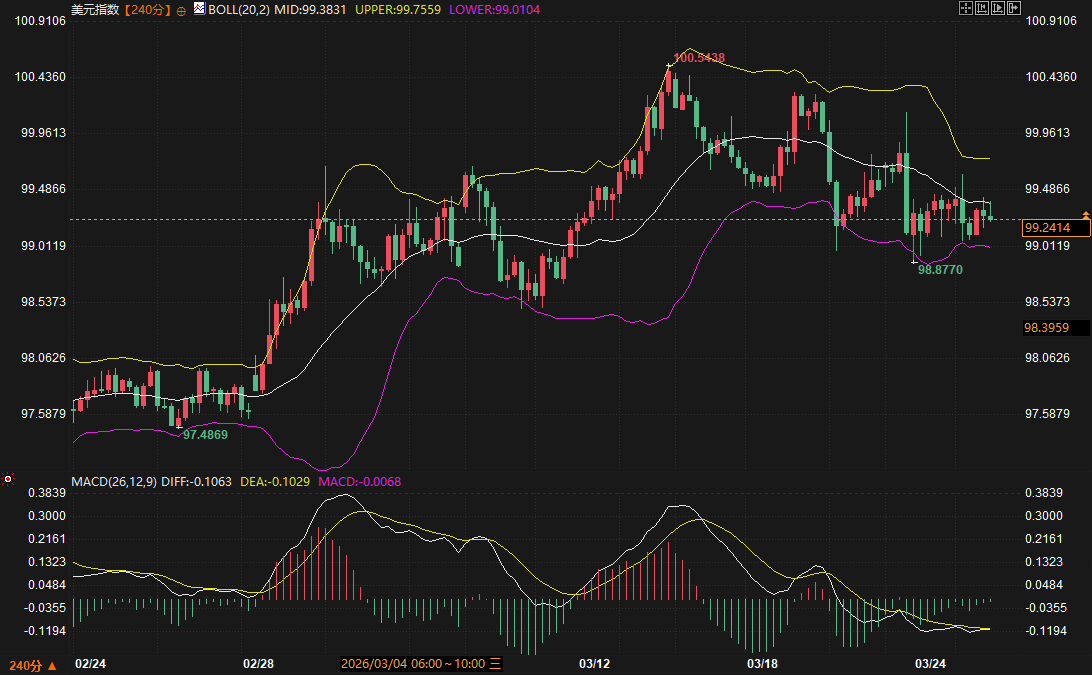
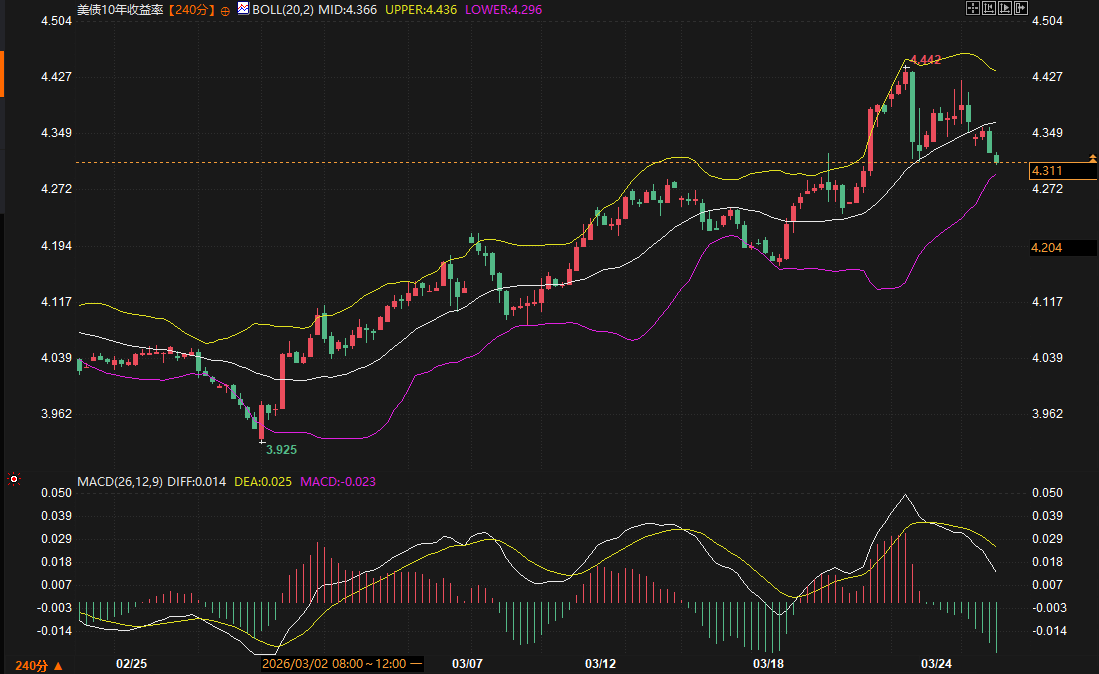
The US dollar index has recently shown a pullback from its highs and is currently fluctuating around 99.2414. The 4-hour candlestick chart shows that after reaching a high of 100.5438, the upward momentum of the dollar has weakened significantly due to the simultaneous decline in US Treasury yields. The 10-year US Treasury yield has fallen rapidly from a high of 4.442% to 4.311%, breaking below the Bollinger Band's middle line with three consecutive bearish candlesticks, directly weakening the dollar's interest rate advantage.
From a technical perspective, the US dollar index is currently seeking support near the lower Bollinger Band at 99.0104. Although the MACD histogram has narrowed and the fast and slow lines are flattening at low levels, indicating a slowdown in the short-term decline, it remains in a high-level correction phase overall. The Q4 current account data and the February import price index, to be released Wednesday evening, may become short-term triggers.
Logically, the Eurozone's weakness has provided some support for the dollar, given Europe's relatively slow progress in artificial intelligence and the pressure of massive military spending. However, in the short term, the trend of US Treasury yields will dominate. It is predicted that the dollar index will remain range-bound between 99.00 and 99.75 over the next 2-3 days. If US Treasury yields further test the lower support level of 4.296%, the dollar may face the risk of breaking below the 99 mark.
Spot gold has been exceptionally strong recently, rebounding sharply in a V-shape after hitting a low of $4099.02 on Monday, and is currently trading at $4578.73. On the 4-hour chart, gold has successfully broken above the Bollinger Band middle line at $4460.72 and is now testing the key resistance level since the pullback from the late February high of $5419.01.
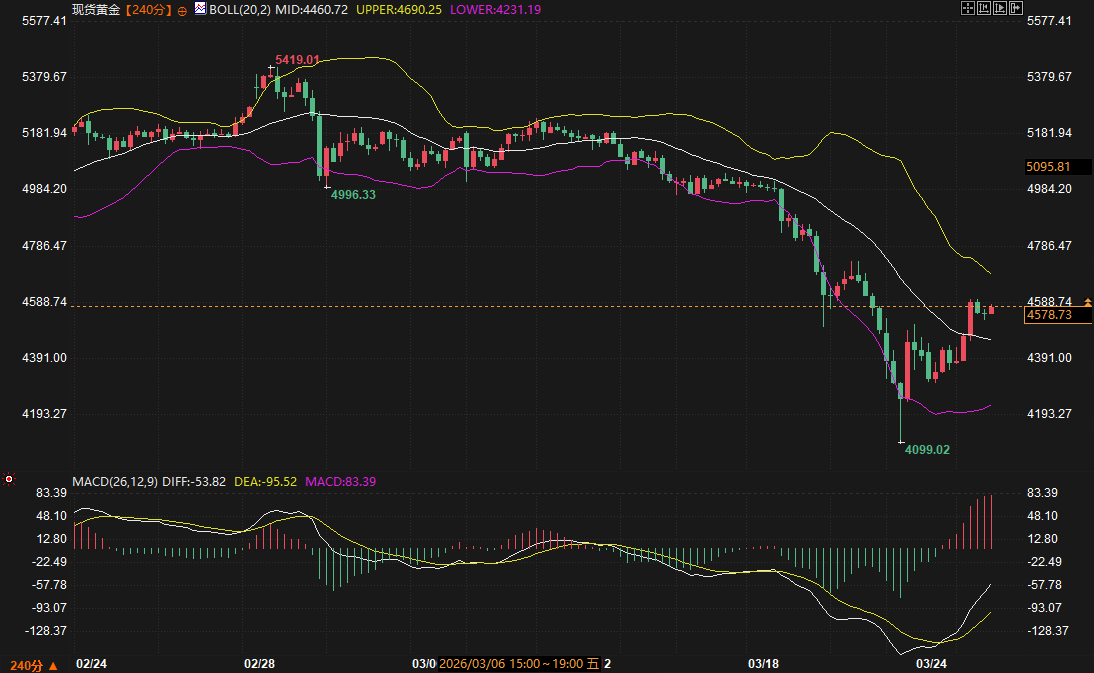
In terms of technical indicators , gold's MACD showed the most aggressive movement, with the red bars continuing to expand and the fast and slow lines diverging upwards at a large angle after forming a golden cross at a low level, indicating that bullish momentum is being released in a concentrated manner. The plunge in crude oil prices has eased market concerns about inflation suppressing interest-bearing assets, and coupled with the recurring safe-haven sentiment, it has provided a double impetus for the recovery in gold prices.
The next 48 to 72 hours will be a crucial confirmation period for gold's price movement. The primary resistance level to watch is the 4588.74 to 4690.25 (upper Bollinger Band) range. Given the significant short-term gains, indicators such as the RSI may be entering overbought territory, and a technical pullback near the resistance level cannot be ruled out. Solid support has moved up to the 4460 level; as long as this level holds above the middle Bollinger Band, the upward trend is considered to continue.
In summary, the market will enter a correction phase following the "post-conflict expectations" over the next 2-3 trading days. Crude oil, constrained by shifts in supply and demand dynamics and geopolitical tensions, is unlikely to reverse its downward trend in the short term. The US dollar, dragged down by falling US Treasury yields, is likely to maintain a weak and volatile trend. Gold, on the other hand, is in control due to a return of bullish sentiment, but caution is advised regarding profit-taking at previous resistance levels. Investors should closely monitor the public statements of Federal Reserve officials on Wednesday and the $70 billion 5-year Treasury auction, which could determine whether the yield curve will flatten further.
1. Why is the sharp drop in crude oil prices actually beneficial to gold?
Normally, crude oil and gold are both commodities and have a positive correlation with inflation, but the logic has recently changed. Previously high crude oil prices exacerbated inflation concerns, prompting market expectations of more aggressive interest rate hikes by central banks, which put downward pressure on gold, which does not accrue interest. The current sharp drop in crude oil prices has reduced expectations of interest rate hikes, and the geopolitical uncertainty reflected in the decline in crude oil prices has prompted safe-haven funds to flow into gold, thus creating a situation where crude oil prices fall while gold prices rise.
2. What is the support logic for the US dollar index at the 99.00 level?
99.00 is not only a psychologically important psychological level, but also near the lower Bollinger Band on the 4-hour chart. Furthermore, considering that the European economic fundamentals are still weaker than those of the US, and that expectations of potential trade barriers stemming from tariff rhetoric typically benefit the US dollar as a safe-haven asset, the dollar is likely to remain resilient around the 99 level unless there is a dramatic collapse in US Treasury yields.
3. Is the rebound in spot gold a reversal or just a bounce?
From a 4-hour chart perspective, gold is currently experiencing a strong oversold rebound. Although the MACD has formed a golden cross and bullish momentum is strong, it is still far from the historical high at the end of February. To determine whether this has turned into a medium- to long-term reversal, we need to observe whether the gold price can break through 4588.74 with significant volume and stabilize above the upper Bollinger Band. In the short term, this is more of a technical correction of the previous rapid decline.
4. What market expectations does the decline in the 10-year US Treasury yield reflect?
Yields fell from above 4.4%, reflecting a softening of market expectations for higher interest rates to persist longer. As lower oil prices eased inflationary pressures, coupled with concerns about the economic growth outlook, investors began buying long-term Treasury bonds as a safe haven, leading to higher prices and lower yields. This also suggests that the market perceives a diminishing need for further aggressive rate hikes by the Federal Reserve.
5. What are the key areas of focus regarding the impact of macroeconomic fundamentals on the market in the coming days?
The key focus is on the implementation of the 15-point peace plan proposed by the US government. If Iran continues to refuse or geopolitical tensions escalate, crude oil prices could recover their losses at any time. Furthermore, the demand for Wednesday's 5-year US Treasury auction will directly impact yields, which will then be transmitted to the gold market through exchange rates.
On Wednesday (March 25), the 10-year US Treasury yield retreated from its highs, reflecting investors' reassessment of interest rate paths amid fluctuating inflation expectations. The US dollar index encountered resistance at higher levels and entered a narrow trading range, while spot gold, which had previously experienced a sharp correction, began a strong oversold rebound. Overall, the sharp decline in crude oil prices eased inflationary pressures in the short term, causing market bets on further Fed rate hikes to fall from 25% to around 16%. This change in the macroeconomic environment provided precious metals with a breather.
Crude oil: A double-top pattern has been established, and short-term bearish momentum is strong.
From a technical perspective, Brent crude oil has shown a clear double-top reversal pattern on the 4-hour chart. Previously, the price attempted to break through the $119 range twice, on March 7th and March 19th, but failed, subsequently initiating a significant decline. Currently, the price has fallen to around $98.54, effectively breaking below the $100 psychological level. The Bollinger Bands indicator shows that the price has moved below the middle band at $104.28 and continues to approach the lower band support area at $94.00.
Fundamentally, the sharp fluctuations in the crude oil market were primarily driven by the fading geopolitical premium. Analysts from well-known institutions pointed out that although the US has offered a peace plan on the diplomatic front, its potential threat to Iran's energy infrastructure remains a Damocles' sword hanging over the market. However, in the short term, the market is more inclined to trade on "ceasefire expectations," leading to a stampede of long positions exiting the market.
The MACD indicator shows that both the DIFF and DEA lines are trending downwards, with the green bars continuing to expand, indicating that the bearish momentum has not yet exhausted itself. In the next 2-3 trading days, the resistance level for crude oil is concentrated at 104.28 (Bollinger Band middle line). If this level cannot be recovered, the price will likely retest the support level in the 94.00-96.30 range.
US Dollar and US Treasuries: Falling yields limit upside potential for the dollar.
The US dollar index has recently shown a pullback from its highs and is currently fluctuating around 99.2414. The 4-hour candlestick chart shows that after reaching a high of 100.5438, the upward momentum of the dollar has weakened significantly due to the simultaneous decline in US Treasury yields. The 10-year US Treasury yield has fallen rapidly from a high of 4.442% to 4.311%, breaking below the Bollinger Band's middle line with three consecutive bearish candlesticks, directly weakening the dollar's interest rate advantage.
From a technical perspective, the US dollar index is currently seeking support near the lower Bollinger Band at 99.0104. Although the MACD histogram has narrowed and the fast and slow lines are flattening at low levels, indicating a slowdown in the short-term decline, it remains in a high-level correction phase overall. The Q4 current account data and the February import price index, to be released Wednesday evening, may become short-term triggers.
Logically, the Eurozone's weakness has provided some support for the dollar, given Europe's relatively slow progress in artificial intelligence and the pressure of massive military spending. However, in the short term, the trend of US Treasury yields will dominate. It is predicted that the dollar index will remain range-bound between 99.00 and 99.75 over the next 2-3 days. If US Treasury yields further test the lower support level of 4.296%, the dollar may face the risk of breaking below the 99 mark.
Spot gold: Oversold rebound momentum released; attention focused on previous resistance test.
Spot gold has been exceptionally strong recently, rebounding sharply in a V-shape after hitting a low of $4099.02 on Monday, and is currently trading at $4578.73. On the 4-hour chart, gold has successfully broken above the Bollinger Band middle line at $4460.72 and is now testing the key resistance level since the pullback from the late February high of $5419.01.
In terms of technical indicators , gold's MACD showed the most aggressive movement, with the red bars continuing to expand and the fast and slow lines diverging upwards at a large angle after forming a golden cross at a low level, indicating that bullish momentum is being released in a concentrated manner. The plunge in crude oil prices has eased market concerns about inflation suppressing interest-bearing assets, and coupled with the recurring safe-haven sentiment, it has provided a double impetus for the recovery in gold prices.
The next 48 to 72 hours will be a crucial confirmation period for gold's price movement. The primary resistance level to watch is the 4588.74 to 4690.25 (upper Bollinger Band) range. Given the significant short-term gains, indicators such as the RSI may be entering overbought territory, and a technical pullback near the resistance level cannot be ruled out. Solid support has moved up to the 4460 level; as long as this level holds above the middle Bollinger Band, the upward trend is considered to continue.
Future Outlook
In summary, the market will enter a correction phase following the "post-conflict expectations" over the next 2-3 trading days. Crude oil, constrained by shifts in supply and demand dynamics and geopolitical tensions, is unlikely to reverse its downward trend in the short term. The US dollar, dragged down by falling US Treasury yields, is likely to maintain a weak and volatile trend. Gold, on the other hand, is in control due to a return of bullish sentiment, but caution is advised regarding profit-taking at previous resistance levels. Investors should closely monitor the public statements of Federal Reserve officials on Wednesday and the $70 billion 5-year Treasury auction, which could determine whether the yield curve will flatten further.
Frequently Asked Questions
1. Why is the sharp drop in crude oil prices actually beneficial to gold?
Normally, crude oil and gold are both commodities and have a positive correlation with inflation, but the logic has recently changed. Previously high crude oil prices exacerbated inflation concerns, prompting market expectations of more aggressive interest rate hikes by central banks, which put downward pressure on gold, which does not accrue interest. The current sharp drop in crude oil prices has reduced expectations of interest rate hikes, and the geopolitical uncertainty reflected in the decline in crude oil prices has prompted safe-haven funds to flow into gold, thus creating a situation where crude oil prices fall while gold prices rise.
2. What is the support logic for the US dollar index at the 99.00 level?
99.00 is not only a psychologically important psychological level, but also near the lower Bollinger Band on the 4-hour chart. Furthermore, considering that the European economic fundamentals are still weaker than those of the US, and that expectations of potential trade barriers stemming from tariff rhetoric typically benefit the US dollar as a safe-haven asset, the dollar is likely to remain resilient around the 99 level unless there is a dramatic collapse in US Treasury yields.
3. Is the rebound in spot gold a reversal or just a bounce?
From a 4-hour chart perspective, gold is currently experiencing a strong oversold rebound. Although the MACD has formed a golden cross and bullish momentum is strong, it is still far from the historical high at the end of February. To determine whether this has turned into a medium- to long-term reversal, we need to observe whether the gold price can break through 4588.74 with significant volume and stabilize above the upper Bollinger Band. In the short term, this is more of a technical correction of the previous rapid decline.
4. What market expectations does the decline in the 10-year US Treasury yield reflect?
Yields fell from above 4.4%, reflecting a softening of market expectations for higher interest rates to persist longer. As lower oil prices eased inflationary pressures, coupled with concerns about the economic growth outlook, investors began buying long-term Treasury bonds as a safe haven, leading to higher prices and lower yields. This also suggests that the market perceives a diminishing need for further aggressive rate hikes by the Federal Reserve.
5. What are the key areas of focus regarding the impact of macroeconomic fundamentals on the market in the coming days?
The key focus is on the implementation of the 15-point peace plan proposed by the US government. If Iran continues to refuse or geopolitical tensions escalate, crude oil prices could recover their losses at any time. Furthermore, the demand for Wednesday's 5-year US Treasury auction will directly impact yields, which will then be transmitted to the gold market through exchange rates.
- Risk Warning and Disclaimer
- The market involves risk, and trading may not be suitable for all investors. This article is for reference only and does not constitute personal investment advice, nor does it take into account certain users’ specific investment objectives, financial situation, or other needs. Any investment decisions made based on this information are at your own risk.