A wave of US Treasury bond sell-offs sweeps the globe! A sudden shift in geopolitical tensions and a MACD bearish divergence suggest a major reversal is imminent?
2026-03-27 20:41:10
Data released by institutions on Friday (March 27) showed that the US Treasury market experienced a significant sell-off, with yields surging across the board to their highest levels since July of last year. Driven by inflation concerns stemming from escalating tensions in the Middle East and soaring energy prices, both 2-year and 10-year Treasury yields broke through key resistance levels. Although the timeframe for debt relief was extended, it failed to alleviate market fears of a global inflation spiral, and short-selling momentum in the bond market continued to mount.
In this round of bond market volatility, macroeconomic geopolitical risks and microeconomic technical signals are resonating strongly. Fundamentally, abnormal fluctuations in energy prices have become a core variable disrupting inflation expectations, and the synchronized decline in bond markets of major global economies indicates a sharp contraction in risk appetite. Technically, yields on key-maturity US Treasury bonds have all reached the extreme area of the upper Bollinger Band, and the MACD indicator has shown a worrying divergence signal. This article will deeply analyze the logic behind swap spreads and the flattening of the yield curve, and, combined with precise technical ranges, reveal potential reversal signals and support/resistance logic within the current high-level consolidation pattern.
According to the latest information from major overseas institutions, the sell-off in the US Treasury market began to emerge during the Tokyo trading session and intensified further as the London and New York sessions commenced. The core trigger lies in the evolving situation in the Middle East. Although the deadline for reopening the Strait of Hormuz has been extended, the market has not responded positively. Conversely, with news of increased military deployments, Brent crude oil prices surged to $111.18, and WTI crude oil touched $97.22, both showing intraday gains exceeding 2.5%.
This cost-push inflationary pressure, driven by energy costs, has directly increased market expectations that global central banks will maintain high interest rates or even raise them further. Data shows that the 10-year US Treasury yield has risen to around 4.456%. Meanwhile, the swap market has lagged behind; while swap spreads have widened slightly, the 5-year swap spread has shown unusual activity, reflecting hesitation among investors regarding maturity selection. Market trading logic has shifted from simple policy speculation to a dual narrative of hedging and inflation protection based on "high inflation, high interest rates, and high risk."
Technical data shows that the adjustment in the 2-year US Treasury yield has significantly exceeded that of longer-term maturities. Currently, the 2-year US Treasury yield is at 4.001%, up approximately 72 basis points from its February low, while the 10-year yield has risen by about 54 basis points over the same period. This asymmetric upward movement has led to a further flattening of the US Treasury yield curve, with the 2-year/10-year spread widening to 46.38 basis points and the 2-year/30-year spread reaching a staggering 98.1 basis points.
From a supply and demand perspective, the "heartland" where 5-year US Treasury bonds are located is under the greatest pressure. Swap spread data shows that the 5-year swap spread was -34.75, narrowing by 0.25 during the day. This uneven distribution of selling pressure indicates that investors are focusing on hedging short-term inflation risks. In addition, the spillover effect of Japanese government bonds (JGBs) cannot be ignored. The weakness of the yen, coupled with the persistence of domestic inflationary pressures in Japan, has jointly pushed up the yield requirements of global bonds.
In the 240-minute timeframe, the 2-year US Treasury yield has shown a very strong upward trend. The current price has successfully broken through the previous resistance level of 3.992% and is trading above that level. The Bollinger Bands show the middle band at 3.926% and the upper band at 4.021%. The yield is currently close to the upper band, indicating strong short-term bullish momentum, but as the price has reached an extreme resistance zone, the probability of a technical pullback is increasing.
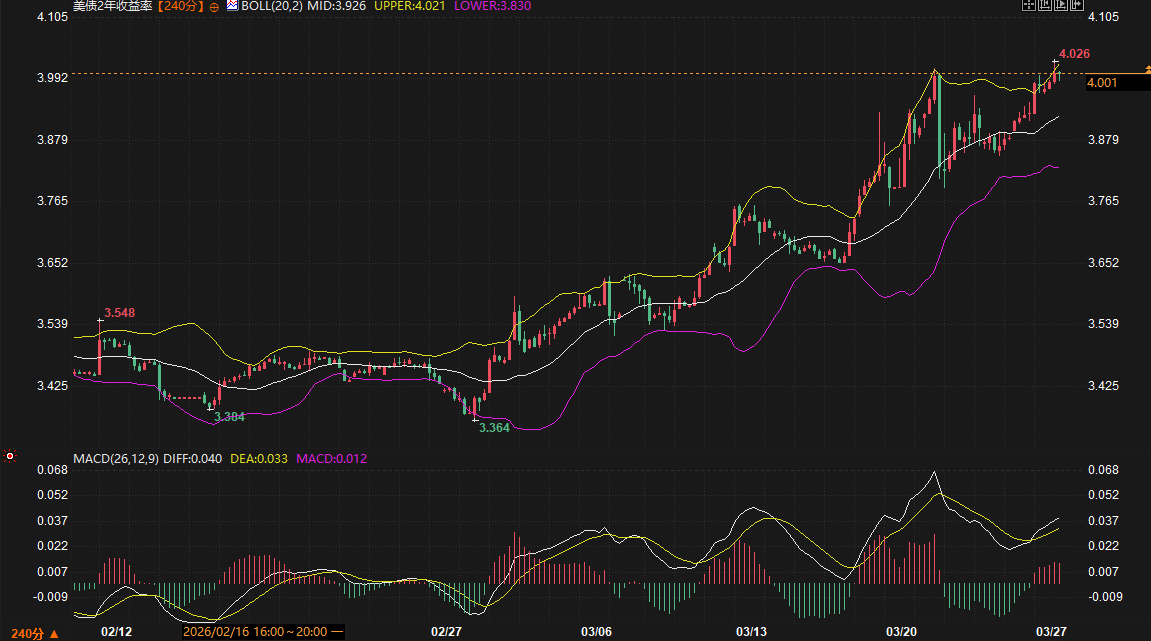
Logically, the MACD indicator is issuing a cautious signal. Although the DIFF and DEA lines remain in a bullish alignment, the height of the red bars has narrowed significantly compared to the peak in mid-March. This bearish divergence—"prices making new highs while indicators fail to"—suggests a marginal weakening of bullish momentum. In the short term, the strong resistance zone for the 2-year US Treasury yield is locked at 4.027% to 4.035%. If it cannot effectively hold above this level, it may retrace to test the 3.926% mid-line support.
The 10-year US Treasury yield moved in close tandem with the short end, but its overbought condition was more pronounced. On the 240-minute chart, the latest quote of 4.473% has broken through the upper Bollinger Band (4.463%). From a technical perspective, after hitting a bottom at 3.925% on February 27, the yield slope has steadily increased, and the consecutive positive candlesticks indicate that the market's short-selling sentiment towards bonds is still being released.
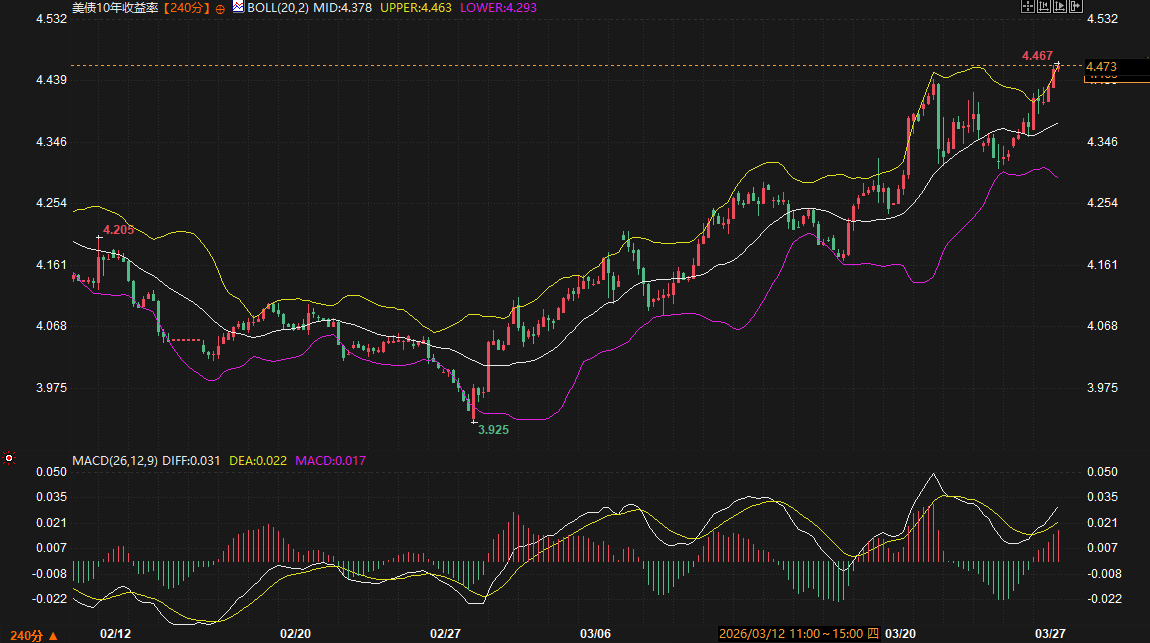
However, rigorous technical analysis indicates that the 10-year yield also faces bearish divergence pressure. While the MACD histogram has slightly expanded, its overall strength is weaker than before. Current prices are in a historically high range, and the previous resistance level of 4.439% has now become short-term support. Logically, if there are any signs of easing geopolitical tensions, the overbought 10-year yield is highly likely to trigger profit-taking, with downside support levels to watch at 4.378% (Bollinger Band middle line) and the 4.293% range.
In the short term, US Treasury yields are expected to remain volatile at high levels, with geopolitical rhetoric and inflation data continuing to be the core drivers of pricing. As both the 2-year and 10-year yields are in overbought territory near the upper Bollinger Band, and a preliminary MACD divergence signal is emerging, the upside potential for yields in the short term is limited, and a technical pullback towards the middle Bollinger Band is likely.
The long-term logic suggests that as long as energy prices remain high and global inflation expectations do not see a fundamental turning point, the bottom support of the yield curve will continue to rise. The 2-year yield is expected to find a new equilibrium in the 3.830% to 4.030% range, while the 10-year yield is likely to remain above 4.300%. Investors need to closely monitor the persistence of the yield curve flattening, as this usually indicates a cautious market attitude towards long-term growth prospects.
Why do rising energy prices have different impacts on short- and long-term US Treasury bonds?
Data analysis suggests that energy prices directly drive up inflation expectations, making short-term US Treasury yields (such as the 2-year yield) more sensitive to the path of monetary policy interest rates. When the market anticipates that high inflation will force central banks to maintain high interest rates, short-term yields tend to react more dramatically. The recent 72 basis point (BP) increase in the 2-year yield and the 54 BP increase in the 10-year yield is precisely because the market has priced in a more frequent or prolonged rate hike path in the short term, leading to short-term yields leading the gains and flattening the yield curve.
How should we interpret the current relationship between US Treasury yields and the upper Bollinger Band?
In technical analysis, when yields reach or break through the upper Bollinger Band (such as 4.463% for the 10-year yield), it usually indicates that the market has entered an overbought state, meaning that selling sentiment is excessively concentrated. In this situation, yields often undergo mean reversion. While this does not represent an immediate trend reversal, it indicates that short-term upside risks have been largely released, and in the absence of additional positive stimuli, the cost-effectiveness of continuing to short bonds is decreasing.
What signals do changes in swap spreads send?
Swap spreads reflect the difference between interbank credit risk and Treasury bond liquidity. Currently, the 5-year swap spread is negative and has narrowed slightly. Combined with the fact that the swap market lags behind the performance of spot US Treasuries, this indicates that the spot market's selling is more direct and drastic in response to inflation risk. The volatility of the spread also reflects the hedging demand for funds in fixed-rate and floating-rate swaps, suggesting that market liquidity remains relatively tight.
How valuable is the MACD indicator's bearish divergence in the current environment?
MACD divergence at the top typically indicates a depletion of price momentum. In the 2-year and 10-year US Treasury yields, despite new highs, the MACD histogram has not surpassed previous levels, suggesting that the upward momentum driving yields is diminishing. In practice, this is often a warning sign that a trend is nearing its end or a deep correction is imminent. Given the current geopolitical uncertainties, this divergence suggests investors should be wary of the risk of a rapid decline in yields.
What are the core risks currently affecting the trend of US Treasury bonds?
The logic suggests that the core risks are concentrated in three aspects: First, the secondary impact of tariff rhetoric and geopolitical situations on supply chains, which may lead to uncontrolled inflation expectations; second, the policy coordination of central banks of major economies, especially if overseas interest rates continue to rise, which will passively drive up US Treasury yields; and third, the liquidity of the US Treasury market, where volatility may be further amplified if there is a lack of buying support during the rapid rise in yields.
In this round of bond market volatility, macroeconomic geopolitical risks and microeconomic technical signals are resonating strongly. Fundamentally, abnormal fluctuations in energy prices have become a core variable disrupting inflation expectations, and the synchronized decline in bond markets of major global economies indicates a sharp contraction in risk appetite. Technically, yields on key-maturity US Treasury bonds have all reached the extreme area of the upper Bollinger Band, and the MACD indicator has shown a worrying divergence signal. This article will deeply analyze the logic behind swap spreads and the flattening of the yield curve, and, combined with precise technical ranges, reveal potential reversal signals and support/resistance logic within the current high-level consolidation pattern.
Energy premium reignites inflation concerns, geopolitical tensions disrupt bond market pricing.
According to the latest information from major overseas institutions, the sell-off in the US Treasury market began to emerge during the Tokyo trading session and intensified further as the London and New York sessions commenced. The core trigger lies in the evolving situation in the Middle East. Although the deadline for reopening the Strait of Hormuz has been extended, the market has not responded positively. Conversely, with news of increased military deployments, Brent crude oil prices surged to $111.18, and WTI crude oil touched $97.22, both showing intraday gains exceeding 2.5%.
This cost-push inflationary pressure, driven by energy costs, has directly increased market expectations that global central banks will maintain high interest rates or even raise them further. Data shows that the 10-year US Treasury yield has risen to around 4.456%. Meanwhile, the swap market has lagged behind; while swap spreads have widened slightly, the 5-year swap spread has shown unusual activity, reflecting hesitation among investors regarding maturity selection. Market trading logic has shifted from simple policy speculation to a dual narrative of hedging and inflation protection based on "high inflation, high interest rates, and high risk."
Short-term yields led the gains, highlighting the flattening of the yield curve.
Technical data shows that the adjustment in the 2-year US Treasury yield has significantly exceeded that of longer-term maturities. Currently, the 2-year US Treasury yield is at 4.001%, up approximately 72 basis points from its February low, while the 10-year yield has risen by about 54 basis points over the same period. This asymmetric upward movement has led to a further flattening of the US Treasury yield curve, with the 2-year/10-year spread widening to 46.38 basis points and the 2-year/30-year spread reaching a staggering 98.1 basis points.
From a supply and demand perspective, the "heartland" where 5-year US Treasury bonds are located is under the greatest pressure. Swap spread data shows that the 5-year swap spread was -34.75, narrowing by 0.25 during the day. This uneven distribution of selling pressure indicates that investors are focusing on hedging short-term inflation risks. In addition, the spillover effect of Japanese government bonds (JGBs) cannot be ignored. The weakness of the yen, coupled with the persistence of domestic inflationary pressures in Japan, has jointly pushed up the yield requirements of global bonds.
2-Year Technical Analysis: Concerns about Divergence After Breaking Through Key Resistance
In the 240-minute timeframe, the 2-year US Treasury yield has shown a very strong upward trend. The current price has successfully broken through the previous resistance level of 3.992% and is trading above that level. The Bollinger Bands show the middle band at 3.926% and the upper band at 4.021%. The yield is currently close to the upper band, indicating strong short-term bullish momentum, but as the price has reached an extreme resistance zone, the probability of a technical pullback is increasing.
Logically, the MACD indicator is issuing a cautious signal. Although the DIFF and DEA lines remain in a bullish alignment, the height of the red bars has narrowed significantly compared to the peak in mid-March. This bearish divergence—"prices making new highs while indicators fail to"—suggests a marginal weakening of bullish momentum. In the short term, the strong resistance zone for the 2-year US Treasury yield is locked at 4.027% to 4.035%. If it cannot effectively hold above this level, it may retrace to test the 3.926% mid-line support.
10-Year Technical Analysis: High-Level Game in Overbought Conditions
The 10-year US Treasury yield moved in close tandem with the short end, but its overbought condition was more pronounced. On the 240-minute chart, the latest quote of 4.473% has broken through the upper Bollinger Band (4.463%). From a technical perspective, after hitting a bottom at 3.925% on February 27, the yield slope has steadily increased, and the consecutive positive candlesticks indicate that the market's short-selling sentiment towards bonds is still being released.
However, rigorous technical analysis indicates that the 10-year yield also faces bearish divergence pressure. While the MACD histogram has slightly expanded, its overall strength is weaker than before. Current prices are in a historically high range, and the previous resistance level of 4.439% has now become short-term support. Logically, if there are any signs of easing geopolitical tensions, the overbought 10-year yield is highly likely to trigger profit-taking, with downside support levels to watch at 4.378% (Bollinger Band middle line) and the 4.293% range.
Trend Outlook
In the short term, US Treasury yields are expected to remain volatile at high levels, with geopolitical rhetoric and inflation data continuing to be the core drivers of pricing. As both the 2-year and 10-year yields are in overbought territory near the upper Bollinger Band, and a preliminary MACD divergence signal is emerging, the upside potential for yields in the short term is limited, and a technical pullback towards the middle Bollinger Band is likely.
The long-term logic suggests that as long as energy prices remain high and global inflation expectations do not see a fundamental turning point, the bottom support of the yield curve will continue to rise. The 2-year yield is expected to find a new equilibrium in the 3.830% to 4.030% range, while the 10-year yield is likely to remain above 4.300%. Investors need to closely monitor the persistence of the yield curve flattening, as this usually indicates a cautious market attitude towards long-term growth prospects.
Frequently Asked Questions
Why do rising energy prices have different impacts on short- and long-term US Treasury bonds?
Data analysis suggests that energy prices directly drive up inflation expectations, making short-term US Treasury yields (such as the 2-year yield) more sensitive to the path of monetary policy interest rates. When the market anticipates that high inflation will force central banks to maintain high interest rates, short-term yields tend to react more dramatically. The recent 72 basis point (BP) increase in the 2-year yield and the 54 BP increase in the 10-year yield is precisely because the market has priced in a more frequent or prolonged rate hike path in the short term, leading to short-term yields leading the gains and flattening the yield curve.
How should we interpret the current relationship between US Treasury yields and the upper Bollinger Band?
In technical analysis, when yields reach or break through the upper Bollinger Band (such as 4.463% for the 10-year yield), it usually indicates that the market has entered an overbought state, meaning that selling sentiment is excessively concentrated. In this situation, yields often undergo mean reversion. While this does not represent an immediate trend reversal, it indicates that short-term upside risks have been largely released, and in the absence of additional positive stimuli, the cost-effectiveness of continuing to short bonds is decreasing.
What signals do changes in swap spreads send?
Swap spreads reflect the difference between interbank credit risk and Treasury bond liquidity. Currently, the 5-year swap spread is negative and has narrowed slightly. Combined with the fact that the swap market lags behind the performance of spot US Treasuries, this indicates that the spot market's selling is more direct and drastic in response to inflation risk. The volatility of the spread also reflects the hedging demand for funds in fixed-rate and floating-rate swaps, suggesting that market liquidity remains relatively tight.
How valuable is the MACD indicator's bearish divergence in the current environment?
MACD divergence at the top typically indicates a depletion of price momentum. In the 2-year and 10-year US Treasury yields, despite new highs, the MACD histogram has not surpassed previous levels, suggesting that the upward momentum driving yields is diminishing. In practice, this is often a warning sign that a trend is nearing its end or a deep correction is imminent. Given the current geopolitical uncertainties, this divergence suggests investors should be wary of the risk of a rapid decline in yields.
What are the core risks currently affecting the trend of US Treasury bonds?
The logic suggests that the core risks are concentrated in three aspects: First, the secondary impact of tariff rhetoric and geopolitical situations on supply chains, which may lead to uncontrolled inflation expectations; second, the policy coordination of central banks of major economies, especially if overseas interest rates continue to rise, which will passively drive up US Treasury yields; and third, the liquidity of the US Treasury market, where volatility may be further amplified if there is a lack of buying support during the rapid rise in yields.
- Risk Warning and Disclaimer
- The market involves risk, and trading may not be suitable for all investors. This article is for reference only and does not constitute personal investment advice, nor does it take into account certain users’ specific investment objectives, financial situation, or other needs. Any investment decisions made based on this information are at your own risk.