


Gold saw a technical rebound at the end of the quarter, surging over 3% intraday.
2026-04-01 01:06:19
On Tuesday (March 31), spot gold rose about 2.86% to $4,640.09 per ounce during the US session, hitting its highest level since March 20.

From a monthly perspective, spot gold fell by approximately 12.1% in March, which, if confirmed, would be the largest monthly decline since October 2008. Silver fell by 22% this month. Platinum and palladium also recorded monthly declines.
US Dollar and External Markets
The dollar index retreated to around 100.0263 during the session, after hitting a recent high of 100.64. The dollar weakened, but is still on track for a monthly gain. A stronger dollar typically makes dollar-denominated precious metals more expensive for holders of other currencies, putting downward pressure on prices.
West Texas Intermediate (WTI) crude oil on the New York Mercantile Exchange is currently trading at around $101.70 per barrel. The yield on the 10-year U.S. Treasury note is 4.298%.
Geopolitics: The ongoing evolution of the situation in the Middle East
The situation in the Middle East is currently the core variable affecting the gold market. Reports indicate that President Trump has informed aides that he is willing to end US military action against Iran, even if the Strait of Hormuz remains closed, with the task of reopening the strait to be addressed at a later date. His objectives are to weaken Iran's naval strength and missile reserves, while simultaneously restoring trade through diplomatic means; if diplomatic efforts fail, the task of reopening the strait will fall to European and Gulf allies.
Meanwhile, several uncertainties remain. Iran's Islamic Revolutionary Guard Corps warned it would strike U.S. businesses in the region starting April 1; an Iranian parliamentary committee approved tolls for ships passing through the Strait of Hormuz; Iran sank a Kuwaiti oil tanker near Dubai; Iran launched three missiles at Israel on Tuesday morning; Spain banned U.S. flights involved in an attack on Iran from its airspace; U.S. Secretary of State Rubio stated that the U.S. might reassess NATO's role in light of the events surrounding Iran. U.S. Defense Secretary Hergesse stated that the next few days would be decisive for a war against Iran and warned that the conflict would escalate further if no agreement was reached.
Inflation and Macroeconomic Data
The war has caused global energy prices to continue to rise, directly impacting inflation data. The national average price of gasoline in the United States has exceeded $4 per gallon for the first time, more than $1 higher than before the war began, marking the highest level in nearly four years.
In the Eurozone, the CPI rose 2.5% year-on-year in March, higher than the previous month's 1.9%, reaching its highest level since January 2025, with rising energy costs being the main driver. Excluding food and energy, core inflation fell to 2.3%, with service sector inflation indicators declining in tandem. These figures were lower than the median forecast of 2.6% in a Bloomberg survey. The higher inflation data has led the market to expect the European Central Bank to have to raise interest rates.
In China, the official manufacturing PMI for March came in at 50.4, higher than the previous month's 49.0 and market expectations of 50.1, marking the highest level since March of last year. Output growth accelerated (March 51.4, February 49.6), new orders surged (March 51.6, February 48.6), and new export orders improved simultaneously (March 49.1, February 45.0). Notably, the input cost PMI rose to 63.9 and the output price PMI rose to 55.4, both reaching their highest levels in four years, primarily driven by rising crude oil and non-ferrous metal prices.
Interest rate expectations: continue to exert downward pressure
Rising energy prices and higher inflation data are jointly influencing market expectations regarding the policy paths of major central banks. According to CME FedWatch data, the market currently expects the Federal Reserve to maintain its benchmark interest rate in the 3.50% to 3.75% range until 2026. A higher interest rate environment reduces the attractiveness of non-yielding assets such as gold and increases the opportunity cost of holding gold. The trend of de-dollarization and continued central bank gold purchases are considered long-term structural factors supporting gold prices.
Technical Analysis
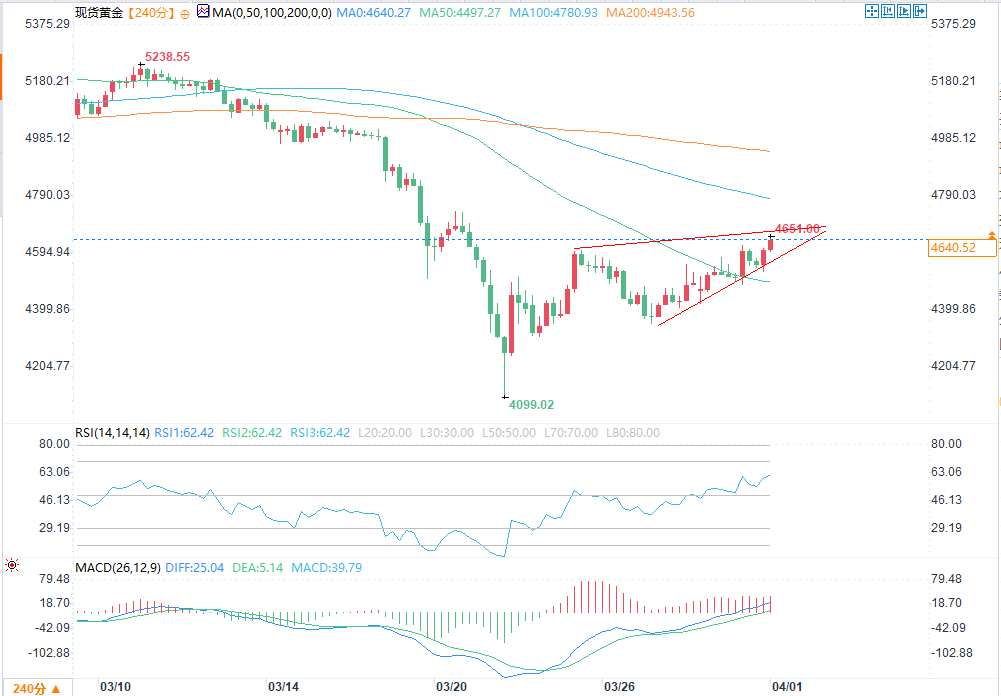
(4-hour chart of spot gold source: EasyForex)
In the spot gold market, the 4-hour chart shows an ascending triangle pattern. The price is trading above the 50-period simple moving average (approximately $4,494), which is currently providing support. The RSI is above the 50 midline, and the MACD is above the zero line and above the signal line, with a positive histogram.
On the upside, a decisive break above the upper trendline of the triangle pattern and a firm hold above $4,600 would target the 100-period moving average at $4,773. On the downside, a breach of $4,494 could see prices fall back to the $4,300-$4,400 range, with deeper support around the March low of $4,100.
From a monthly perspective, spot gold fell by approximately 12.1% in March, which, if confirmed, would be the largest monthly decline since October 2008. Silver fell by 22% this month. Platinum and palladium also recorded monthly declines.
US Dollar and External Markets
The dollar index retreated to around 100.0263 during the session, after hitting a recent high of 100.64. The dollar weakened, but is still on track for a monthly gain. A stronger dollar typically makes dollar-denominated precious metals more expensive for holders of other currencies, putting downward pressure on prices.
West Texas Intermediate (WTI) crude oil on the New York Mercantile Exchange is currently trading at around $101.70 per barrel. The yield on the 10-year U.S. Treasury note is 4.298%.
Geopolitics: The ongoing evolution of the situation in the Middle East
The situation in the Middle East is currently the core variable affecting the gold market. Reports indicate that President Trump has informed aides that he is willing to end US military action against Iran, even if the Strait of Hormuz remains closed, with the task of reopening the strait to be addressed at a later date. His objectives are to weaken Iran's naval strength and missile reserves, while simultaneously restoring trade through diplomatic means; if diplomatic efforts fail, the task of reopening the strait will fall to European and Gulf allies.
Meanwhile, several uncertainties remain. Iran's Islamic Revolutionary Guard Corps warned it would strike U.S. businesses in the region starting April 1; an Iranian parliamentary committee approved tolls for ships passing through the Strait of Hormuz; Iran sank a Kuwaiti oil tanker near Dubai; Iran launched three missiles at Israel on Tuesday morning; Spain banned U.S. flights involved in an attack on Iran from its airspace; U.S. Secretary of State Rubio stated that the U.S. might reassess NATO's role in light of the events surrounding Iran. U.S. Defense Secretary Hergesse stated that the next few days would be decisive for a war against Iran and warned that the conflict would escalate further if no agreement was reached.
Inflation and Macroeconomic Data
The war has caused global energy prices to continue to rise, directly impacting inflation data. The national average price of gasoline in the United States has exceeded $4 per gallon for the first time, more than $1 higher than before the war began, marking the highest level in nearly four years.
In the Eurozone, the CPI rose 2.5% year-on-year in March, higher than the previous month's 1.9%, reaching its highest level since January 2025, with rising energy costs being the main driver. Excluding food and energy, core inflation fell to 2.3%, with service sector inflation indicators declining in tandem. These figures were lower than the median forecast of 2.6% in a Bloomberg survey. The higher inflation data has led the market to expect the European Central Bank to have to raise interest rates.
In China, the official manufacturing PMI for March came in at 50.4, higher than the previous month's 49.0 and market expectations of 50.1, marking the highest level since March of last year. Output growth accelerated (March 51.4, February 49.6), new orders surged (March 51.6, February 48.6), and new export orders improved simultaneously (March 49.1, February 45.0). Notably, the input cost PMI rose to 63.9 and the output price PMI rose to 55.4, both reaching their highest levels in four years, primarily driven by rising crude oil and non-ferrous metal prices.
Interest rate expectations: continue to exert downward pressure
Rising energy prices and higher inflation data are jointly influencing market expectations regarding the policy paths of major central banks. According to CME FedWatch data, the market currently expects the Federal Reserve to maintain its benchmark interest rate in the 3.50% to 3.75% range until 2026. A higher interest rate environment reduces the attractiveness of non-yielding assets such as gold and increases the opportunity cost of holding gold. The trend of de-dollarization and continued central bank gold purchases are considered long-term structural factors supporting gold prices.
Technical Analysis
(4-hour chart of spot gold source: EasyForex)
In the spot gold market, the 4-hour chart shows an ascending triangle pattern. The price is trading above the 50-period simple moving average (approximately $4,494), which is currently providing support. The RSI is above the 50 midline, and the MACD is above the zero line and above the signal line, with a positive histogram.
On the upside, a decisive break above the upper trendline of the triangle pattern and a firm hold above $4,600 would target the 100-period moving average at $4,773. On the downside, a breach of $4,494 could see prices fall back to the $4,300-$4,400 range, with deeper support around the March low of $4,100.
- Risk Warning and Disclaimer
- The market involves risk, and trading may not be suitable for all investors. This article is for reference only and does not constitute personal investment advice, nor does it take into account certain users’ specific investment objectives, financial situation, or other needs. Any investment decisions made based on this information are at your own risk.
