An April Fool's Day "fake fall"? With a US aircraft carrier looming near the border, the dollar is collapsing and yields are plummeting—a deceptive tactic is unfolding.
2026-04-01 19:53:24
On Wednesday (April 1), global financial markets experienced significant volatility due to a confluence of complex factors. Influenced by geopolitical news, the release of key macroeconomic data, and frequent statements from Federal Reserve officials, risk aversion sentiment shifted dramatically between the Asian and European/American sessions.
The current market logic revolves around the spillover effects of the Russia-Ukraine conflict and the stability of the Middle East energy supply chain. Earlier, rumors of a potential compromise among the parties involved spurred a surge in market risk appetite, causing the Nikkei index to jump 5.2% in a single day. Safe-haven funds began withdrawing from safe-haven assets, putting pressure on both the US dollar index and US Treasury yields. However, with reports from prominent institutions of a US naval fleet moving towards the conflict zone and strong statements regarding control of the Strait of Hormuz, the market began to question whether previous optimistic expectations were merely an April Fool's joke.
On the economic fundamentals front, the release of March's ADP employment figures and manufacturing PMI data is prompting a reassessment of market expectations for inflation in the second half of the year. As logistical bottlenecks cause global factory input costs to surge, inflationary pressures are resurfacing through supply chain transmission, making the trajectory of the US dollar and US Treasury bonds increasingly unpredictable.
The US dollar index recently exhibited a significant "double top" pattern after reaching a high of 100.6400, leading to a pullback. From a fundamental perspective, the dollar's safe-haven status is facing unprecedented challenges. Despite geopolitical tensions, market concerns about policy volatility stemming from US fiscal independence and tariff rhetoric have resulted in a more diversified flow of safe-haven funds.
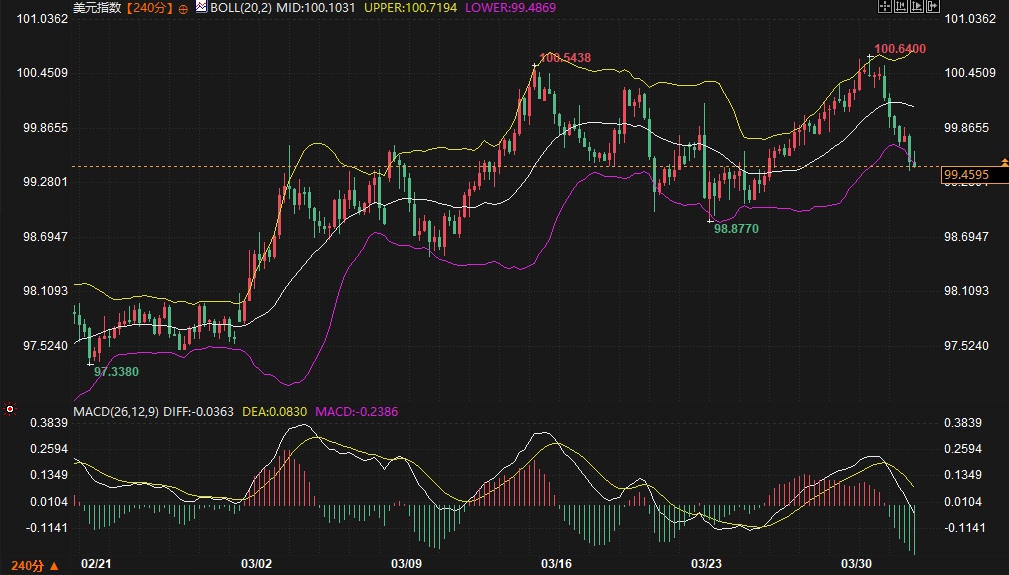
From a technical perspective, the 240-minute chart shows that the US dollar index has fallen below the Bollinger Band middle line at 100.1031 . In the MACD indicator, the DIFF line and DEA line have formed a death cross at a high level, and the green momentum bars continue to expand, indicating that short-term bearish forces still dominate.
Support and resistance forecasts:
In the short term, the key support zone for the US dollar index is between 99.00 and 99.20 . This area not only represents the bottom of the previous trading range but also a psychological level. If geopolitical tensions further ease, the dollar may test this support zone. Conversely, if the conflict escalates and drives oil prices back above $110, the first resistance level to watch is the Bollinger Band middle line at 100.10 , with strong resistance near the previous high of 100.64 .
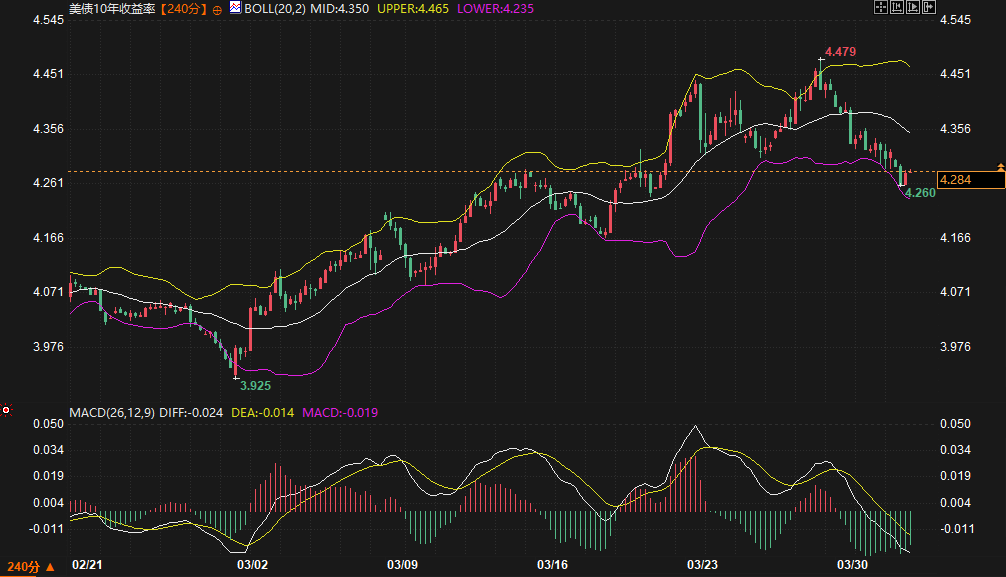
The US Treasury market is currently caught in a tug-of-war between inflation expectations and safe-haven buying. The 10-year Treasury yield has fallen rapidly from a high of 4.479%, reflecting market lingering hopes for an early truce and driving some short-term buying. However, this optimism is facing real challenges: on the one hand, the upcoming $69 billion 17-week Treasury auction may face weak demand; on the other hand, soaring manufacturing costs are contributing to inflation stickiness.
From a technical perspective, the 10-year US Treasury yield is currently in a step-down decline, and the MACD green histogram is gradually lengthening, indicating that the downward pressure has not yet subsided. The current price of 4.284% is just a step away from the lower Bollinger Band at 4.235% .
Support and resistance forecasts:
Over the next 2-3 days, the first support level for yields is seen at 4.235% . A break below this level would likely lead to further declines towards the densely traded 4.15% - 4.20% range. The main resistance level is concentrated at 4.350% (Bollinger Band middle line). Given the current high energy prices, a rise in yields above this level would strengthen market expectations of persistently high interest rates.
The US dollar and US Treasury bonds have shown a very high degree of consistency in the past 48 hours. This synchronized decline reveals the core of current asset pricing: the redistribution of risk premiums .
First, the Japanese market's reaction is a bellwether. Because Asian economies such as Taiwan, the Philippines, and Japan are highly dependent on oil from the Strait of Hormuz, soaring energy costs are squeezing manufacturing profits. When signals of de-escalation emerge in the market, risk aversion subsides, causing US Treasury yields and the US dollar to weaken in tandem.
Secondly, the distorted logic of inflation warrants attention. Traditionally, cost-push inflation would boost yields and support exchange rates, but current war disruptions have made supply chains extremely vulnerable. If energy prices remain above $100 per barrel for an extended period, it could trigger concerns about stagflation in the US economy. At that point, the dollar and US Treasury bonds might diverge—US Treasury yields would rise due to inflation risk premiums, while the dollar might be pressured by weak economic fundamentals.
Looking ahead to the next 2-3 trading days, the market will enter a sensitive observation period. Given the unpredictability of news during April Fool's Day, investors need to exercise extreme caution.
Market data suggests that the short-term correction in the US dollar and US Treasury bonds is not yet complete, especially given the weaker-than-expected performance of the pre-April non-farm payroll data (such as ADP data), which will further suppress bullish sentiment. If there is no substantial military easing in the Middle East situation within the next two days, and oil prices find support at the $100 level, the US dollar index and US Treasury yields are likely to experience a weak rebound after testing the lower support range. Market participants should pay close attention to the strength of the lower Bollinger Band; any significant break below this key support level could trigger a larger-scale stop-loss sell-off.
1. Why hasn't the US dollar surged despite recent geopolitical tensions?
A: Traditional safe-haven logic has been less effective in this conflict. On one hand, the dollar's current valuation is relatively high, creating profit-taking pressure in the market. On the other hand, the uncertainty surrounding the US government's tariff rhetoric and fiscal policy has diminished the dollar's appeal as a single safe-haven asset. Furthermore, market concerns that soaring energy prices could severely impact US consumer spending have also limited the dollar's upside potential.
2. Does the recent rapid decline in US Treasury yields mean that the threat of inflation has disappeared?
A: No, that's not the case. The recent decline in yields is more driven by optimistic expectations that the geopolitical situation may end sooner rather than later. In fact, the latest PMI data shows that manufacturing input costs are rising at their fastest pace in 19 months. If the situation remains deadlocked, inflation compensation will push long-term US Treasury yields back up.
3. How does the situation in the Strait of Hormuz directly affect the correlation between US Treasury bonds and the US dollar?
A: The strait is a vital global energy lifeline. If the strait were blocked, soaring oil prices would directly impact the US CPI. This would force the Federal Reserve to postpone interest rate cuts, supporting the dollar from an interest rate differential perspective and pushing up US Treasury yields. The current synchronized decline is actually the market trading on the expectation that "the situation will not escalate to the point of blocking the strait."
4. What guidance will the March manufacturing PMI data provide for the market in the coming days?
A: The sub-indices of the PMI data show that although output increased, the extended "supplier delivery time" led to a false sense of prosperity in the index. This means that the manufacturing recovery is extremely fragile. The market will digest this detail in the next 2-3 days, and if subsequent retail data is weak, the US dollar may fall below the 99.00 support level.
5. Why is there a risk of "media misrepresentation" in the current asset price fluctuations?
A: As it is early April, some statements about the war ending within 2-3 weeks logically contradict actual military deployments (such as the deployment of aircraft carrier strike groups). This information gap can lead to sharp market reversals within 48 hours, and investors should be wary of false breakouts near support/resistance levels.
The current market logic revolves around the spillover effects of the Russia-Ukraine conflict and the stability of the Middle East energy supply chain. Earlier, rumors of a potential compromise among the parties involved spurred a surge in market risk appetite, causing the Nikkei index to jump 5.2% in a single day. Safe-haven funds began withdrawing from safe-haven assets, putting pressure on both the US dollar index and US Treasury yields. However, with reports from prominent institutions of a US naval fleet moving towards the conflict zone and strong statements regarding control of the Strait of Hormuz, the market began to question whether previous optimistic expectations were merely an April Fool's joke.
On the economic fundamentals front, the release of March's ADP employment figures and manufacturing PMI data is prompting a reassessment of market expectations for inflation in the second half of the year. As logistical bottlenecks cause global factory input costs to surge, inflationary pressures are resurfacing through supply chain transmission, making the trajectory of the US dollar and US Treasury bonds increasingly unpredictable.
Fundamentals and technicals are deeply intertwined: the safe-haven appeal of the US dollar index is weakening.
The US dollar index recently exhibited a significant "double top" pattern after reaching a high of 100.6400, leading to a pullback. From a fundamental perspective, the dollar's safe-haven status is facing unprecedented challenges. Despite geopolitical tensions, market concerns about policy volatility stemming from US fiscal independence and tariff rhetoric have resulted in a more diversified flow of safe-haven funds.
From a technical perspective, the 240-minute chart shows that the US dollar index has fallen below the Bollinger Band middle line at 100.1031 . In the MACD indicator, the DIFF line and DEA line have formed a death cross at a high level, and the green momentum bars continue to expand, indicating that short-term bearish forces still dominate.
Support and resistance forecasts:
In the short term, the key support zone for the US dollar index is between 99.00 and 99.20 . This area not only represents the bottom of the previous trading range but also a psychological level. If geopolitical tensions further ease, the dollar may test this support zone. Conversely, if the conflict escalates and drives oil prices back above $110, the first resistance level to watch is the Bollinger Band middle line at 100.10 , with strong resistance near the previous high of 100.64 .
Yield Curve and Auction Pressure: A Tug-of-War Between Bulls and Bears in the US Treasury Market
The US Treasury market is currently caught in a tug-of-war between inflation expectations and safe-haven buying. The 10-year Treasury yield has fallen rapidly from a high of 4.479%, reflecting market lingering hopes for an early truce and driving some short-term buying. However, this optimism is facing real challenges: on the one hand, the upcoming $69 billion 17-week Treasury auction may face weak demand; on the other hand, soaring manufacturing costs are contributing to inflation stickiness.
From a technical perspective, the 10-year US Treasury yield is currently in a step-down decline, and the MACD green histogram is gradually lengthening, indicating that the downward pressure has not yet subsided. The current price of 4.284% is just a step away from the lower Bollinger Band at 4.235% .
Support and resistance forecasts:
Over the next 2-3 days, the first support level for yields is seen at 4.235% . A break below this level would likely lead to further declines towards the densely traded 4.15% - 4.20% range. The main resistance level is concentrated at 4.350% (Bollinger Band middle line). Given the current high energy prices, a rise in yields above this level would strengthen market expectations of persistently high interest rates.
Cross-market linkage analysis: the link between energy costs and supply chains
The US dollar and US Treasury bonds have shown a very high degree of consistency in the past 48 hours. This synchronized decline reveals the core of current asset pricing: the redistribution of risk premiums .
First, the Japanese market's reaction is a bellwether. Because Asian economies such as Taiwan, the Philippines, and Japan are highly dependent on oil from the Strait of Hormuz, soaring energy costs are squeezing manufacturing profits. When signals of de-escalation emerge in the market, risk aversion subsides, causing US Treasury yields and the US dollar to weaken in tandem.
Secondly, the distorted logic of inflation warrants attention. Traditionally, cost-push inflation would boost yields and support exchange rates, but current war disruptions have made supply chains extremely vulnerable. If energy prices remain above $100 per barrel for an extended period, it could trigger concerns about stagflation in the US economy. At that point, the dollar and US Treasury bonds might diverge—US Treasury yields would rise due to inflation risk premiums, while the dollar might be pressured by weak economic fundamentals.
Future Outlook
Looking ahead to the next 2-3 trading days, the market will enter a sensitive observation period. Given the unpredictability of news during April Fool's Day, investors need to exercise extreme caution.
Market data suggests that the short-term correction in the US dollar and US Treasury bonds is not yet complete, especially given the weaker-than-expected performance of the pre-April non-farm payroll data (such as ADP data), which will further suppress bullish sentiment. If there is no substantial military easing in the Middle East situation within the next two days, and oil prices find support at the $100 level, the US dollar index and US Treasury yields are likely to experience a weak rebound after testing the lower support range. Market participants should pay close attention to the strength of the lower Bollinger Band; any significant break below this key support level could trigger a larger-scale stop-loss sell-off.
Frequently Asked Questions
1. Why hasn't the US dollar surged despite recent geopolitical tensions?
A: Traditional safe-haven logic has been less effective in this conflict. On one hand, the dollar's current valuation is relatively high, creating profit-taking pressure in the market. On the other hand, the uncertainty surrounding the US government's tariff rhetoric and fiscal policy has diminished the dollar's appeal as a single safe-haven asset. Furthermore, market concerns that soaring energy prices could severely impact US consumer spending have also limited the dollar's upside potential.
2. Does the recent rapid decline in US Treasury yields mean that the threat of inflation has disappeared?
A: No, that's not the case. The recent decline in yields is more driven by optimistic expectations that the geopolitical situation may end sooner rather than later. In fact, the latest PMI data shows that manufacturing input costs are rising at their fastest pace in 19 months. If the situation remains deadlocked, inflation compensation will push long-term US Treasury yields back up.
3. How does the situation in the Strait of Hormuz directly affect the correlation between US Treasury bonds and the US dollar?
A: The strait is a vital global energy lifeline. If the strait were blocked, soaring oil prices would directly impact the US CPI. This would force the Federal Reserve to postpone interest rate cuts, supporting the dollar from an interest rate differential perspective and pushing up US Treasury yields. The current synchronized decline is actually the market trading on the expectation that "the situation will not escalate to the point of blocking the strait."
4. What guidance will the March manufacturing PMI data provide for the market in the coming days?
A: The sub-indices of the PMI data show that although output increased, the extended "supplier delivery time" led to a false sense of prosperity in the index. This means that the manufacturing recovery is extremely fragile. The market will digest this detail in the next 2-3 days, and if subsequent retail data is weak, the US dollar may fall below the 99.00 support level.
5. Why is there a risk of "media misrepresentation" in the current asset price fluctuations?
A: As it is early April, some statements about the war ending within 2-3 weeks logically contradict actual military deployments (such as the deployment of aircraft carrier strike groups). This information gap can lead to sharp market reversals within 48 hours, and investors should be wary of false breakouts near support/resistance levels.
- Risk Warning and Disclaimer
- The market involves risk, and trading may not be suitable for all investors. This article is for reference only and does not constitute personal investment advice, nor does it take into account certain users’ specific investment objectives, financial situation, or other needs. Any investment decisions made based on this information are at your own risk.