The battle intensifies: Gold breaks below 4800, technical indicators point to a decisive battle in the 4370-5000 range.
2026-04-02 19:04:19
On Thursday (April 2nd) during the European session, spot gold experienced a rollercoaster-like price movement, characterized by an early surge, a sharp drop mid-session, and subsequent low-level consolidation, resulting in significant volatility throughout the day. Gold prices encountered strong selling pressure after reaching a near two-week high of $4800, causing a sharp decline and abruptly ending the previous four-day upward trend. This pullback was primarily driven by the overall strengthening of the US dollar index – as a core precious metal priced in US dollars, gold typically exhibits a negative correlation with the dollar, and the strong rise of the dollar directly weakened global investors' demand for gold.

The key trigger for this market shift was the latest statement from US President Trump. In his overnight speech, he indicated that the conflict with Iran was expected to end within the next two to three weeks, but simultaneously issued a strong warning: if the two sides fail to reach an agreement, Iran will face "extremely severe blows." This contradictory statement complicated the market narrative: on the one hand, the expectation of easing tensions initially cooled risk aversion, with some funds flowing from gold to risk assets; on the other hand, Trump's tough stance exacerbated the uncertainty of escalating geopolitical tensions, prompting investors to reassess the allocation value of safe-haven assets. This intertwined, contradictory market expectations ultimately drove funds towards the US dollar, which combines safe-haven attributes with stable returns, further strengthening the dollar's safe-haven appeal.
Meanwhile, the aftershocks of geopolitical tensions continue to impact the energy market. Reports indicate that the UAE is actively pushing for the reopening of the Strait of Hormuz and lobbying the UN Security Council for a related resolution. As a crucial chokepoint for global oil transportation, the safety of navigation through the Strait of Hormuz directly affects the stability of the global energy supply chain—it handles approximately one-third of global seaborne oil trade, and its situation has a decisive impact on international oil price fluctuations. Boosted by this news, oil prices, which had recently been declining, rebounded significantly, reigniting market concerns about inflation. Rising inflation expectations further reinforce the market's assessment that the Federal Reserve will maintain its high-interest-rate policy. Investors generally believe that to curb persistently high inflationary pressures, the Fed may maintain the current high interest rate level for an extended period, an expectation that has become another key factor suppressing gold prices.
For gold, which has no fixed income, a high-interest-rate environment has always been a disadvantage. On the one hand, the yield on US Treasury bonds rises as interest rate expectations increase, significantly increasing the opportunity cost of holding gold. Investors cannot earn interest income by holding gold, while depositing funds in dollar assets or buying Treasury bonds can obtain stable interest returns, which makes gold relatively less attractive. On the other hand, a stronger dollar means that the cost of buying gold for holders of non-US currencies increases significantly, further suppressing global demand for gold.
Under the combined effect of multiple negative factors, gold prices fell sharply by about $150 from their peak during the Asian trading session, representing a significant short-term correction. The market remains highly dependent on breaking news; geopolitical developments, Federal Reserve policy signals, and energy price fluctuations can all trigger sharp market reactions, and gold price volatility is expected to remain high in the short term.
Technical Analysis
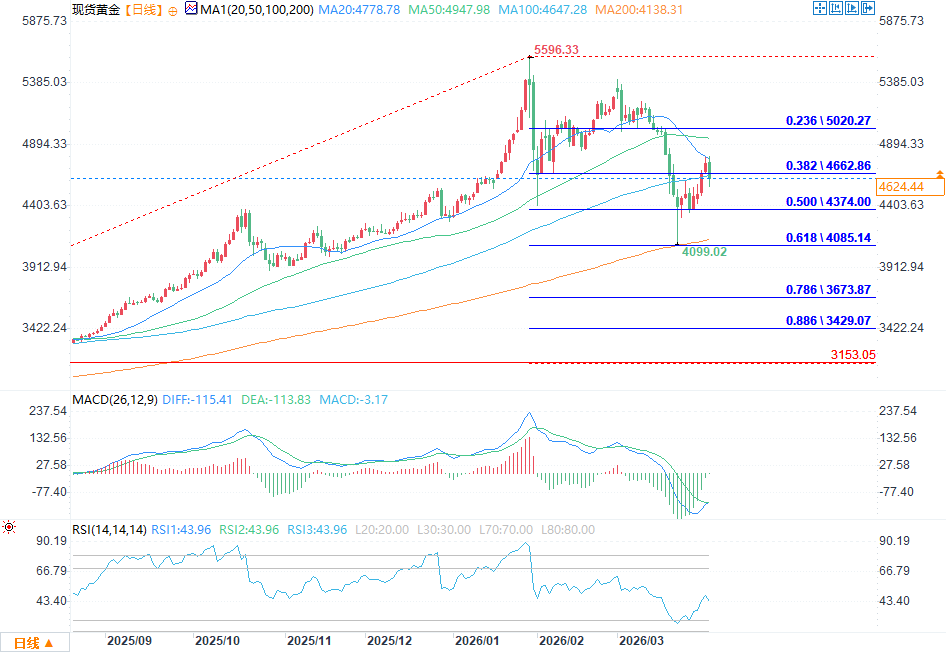
(Spot gold daily chart source: FX678)
Gold prices rebounded from near the 200-day simple moving average (200SMA), but encountered resistance at the key resistance level of $4,800 – a level that also coincides with the 20-day simple moving average (20SMA), representing double technical resistance. Subsequently, gold prices fluctuated downwards, breaking below the $4,650 support level (which corresponds to the 38.2% Fibonacci retracement of the upward move from the $3,150 low to the $5,598 high), and are currently testing the $4,600 psychological support level, which has become a crucial short-term technical defense.
?
From a technical perspective, if the bearish momentum continues and gold prices break below the $4,600 support level, they may further decline to $4,370 – this level represents both the 50% Fibonacci retracement and the high from last October, making it a strong technical reference point. If the $4,370 support fails, gold prices will continue towards the 200-day simple moving average (200SMA) at $4,140, with further support at the 2026 low of $4,100.
Conversely, if gold prices can stabilize and rebound at the $4,600 level, they need to first break through $4,650 (the 38.2% Fibonacci retracement level + short-term support turned resistance level) to open up further upside potential. If they can break through $4,800 with significant volume (the location of the 20-SMA + a double technical resistance level), the short-term rebound trend is expected to continue, and the $5,000 psychological level will become the next important target. This price level combines the technical significance of the 50-day simple moving average (50SMA) and the 23.6% Fibonacci retracement level, and is likely to become a key battleground for the bulls and bears.
The key trigger for this market shift was the latest statement from US President Trump. In his overnight speech, he indicated that the conflict with Iran was expected to end within the next two to three weeks, but simultaneously issued a strong warning: if the two sides fail to reach an agreement, Iran will face "extremely severe blows." This contradictory statement complicated the market narrative: on the one hand, the expectation of easing tensions initially cooled risk aversion, with some funds flowing from gold to risk assets; on the other hand, Trump's tough stance exacerbated the uncertainty of escalating geopolitical tensions, prompting investors to reassess the allocation value of safe-haven assets. This intertwined, contradictory market expectations ultimately drove funds towards the US dollar, which combines safe-haven attributes with stable returns, further strengthening the dollar's safe-haven appeal.
Meanwhile, the aftershocks of geopolitical tensions continue to impact the energy market. Reports indicate that the UAE is actively pushing for the reopening of the Strait of Hormuz and lobbying the UN Security Council for a related resolution. As a crucial chokepoint for global oil transportation, the safety of navigation through the Strait of Hormuz directly affects the stability of the global energy supply chain—it handles approximately one-third of global seaborne oil trade, and its situation has a decisive impact on international oil price fluctuations. Boosted by this news, oil prices, which had recently been declining, rebounded significantly, reigniting market concerns about inflation. Rising inflation expectations further reinforce the market's assessment that the Federal Reserve will maintain its high-interest-rate policy. Investors generally believe that to curb persistently high inflationary pressures, the Fed may maintain the current high interest rate level for an extended period, an expectation that has become another key factor suppressing gold prices.
For gold, which has no fixed income, a high-interest-rate environment has always been a disadvantage. On the one hand, the yield on US Treasury bonds rises as interest rate expectations increase, significantly increasing the opportunity cost of holding gold. Investors cannot earn interest income by holding gold, while depositing funds in dollar assets or buying Treasury bonds can obtain stable interest returns, which makes gold relatively less attractive. On the other hand, a stronger dollar means that the cost of buying gold for holders of non-US currencies increases significantly, further suppressing global demand for gold.
Under the combined effect of multiple negative factors, gold prices fell sharply by about $150 from their peak during the Asian trading session, representing a significant short-term correction. The market remains highly dependent on breaking news; geopolitical developments, Federal Reserve policy signals, and energy price fluctuations can all trigger sharp market reactions, and gold price volatility is expected to remain high in the short term.
Technical Analysis
(Spot gold daily chart source: FX678)
Gold prices rebounded from near the 200-day simple moving average (200SMA), but encountered resistance at the key resistance level of $4,800 – a level that also coincides with the 20-day simple moving average (20SMA), representing double technical resistance. Subsequently, gold prices fluctuated downwards, breaking below the $4,650 support level (which corresponds to the 38.2% Fibonacci retracement of the upward move from the $3,150 low to the $5,598 high), and are currently testing the $4,600 psychological support level, which has become a crucial short-term technical defense.
?
From a technical perspective, if the bearish momentum continues and gold prices break below the $4,600 support level, they may further decline to $4,370 – this level represents both the 50% Fibonacci retracement and the high from last October, making it a strong technical reference point. If the $4,370 support fails, gold prices will continue towards the 200-day simple moving average (200SMA) at $4,140, with further support at the 2026 low of $4,100.
Conversely, if gold prices can stabilize and rebound at the $4,600 level, they need to first break through $4,650 (the 38.2% Fibonacci retracement level + short-term support turned resistance level) to open up further upside potential. If they can break through $4,800 with significant volume (the location of the 20-SMA + a double technical resistance level), the short-term rebound trend is expected to continue, and the $5,000 psychological level will become the next important target. This price level combines the technical significance of the 50-day simple moving average (50SMA) and the 23.6% Fibonacci retracement level, and is likely to become a key battleground for the bulls and bears.
- Risk Warning and Disclaimer
- The market involves risk, and trading may not be suitable for all investors. This article is for reference only and does not constitute personal investment advice, nor does it take into account certain users’ specific investment objectives, financial situation, or other needs. Any investment decisions made based on this information are at your own risk.