A sudden ceasefire negotiation between the US and Iran! Gold rebounded from $4,600, but was firmly suppressed by the Federal Reserve's "high interest rates for longer" policy.
2026-04-06 14:10:10
Amidst dramatic global geopolitical fluctuations, gold prices initially approached record highs before pulling back, but found strong support near the key psychological level of $4,600, leading to a rebound. Spot gold briefly rose to around $4,678 per ounce. However, despite a slight recovery in safe-haven demand, gold's upside potential has been significantly limited, and the overall trend remains cautious, with spot gold currently hovering around the $4,660 mark.
During Monday's Asian trading session, gold (XAU/USD) found support near the $4,600 level and rebounded significantly. Although the rebound was limited and follow-up buying was not particularly strong, the movement still injected some confidence into the market.
According to Axios, the United States, Iran, and regional mediators are in in-depth discussions regarding a potential 45-day ceasefire agreement . If reached, this agreement could bring an end to the ongoing conflict. This news directly pressured the safe-haven dollar, thus providing crucial support for gold prices.
However, as a non-yielding asset, gold's upside potential remains significantly constrained by the global interest rate outlook. The market generally believes that war-induced energy price increases could further fuel inflationary pressures, forcing major central banks, including the Federal Reserve, to maintain or even strengthen their tightening policies.
Investors are currently paying close attention to developments in the energy market. Crude oil prices surged on Monday, hitting a near four-week high. This was largely due to US President Trump's tough stance: if the Strait of Hormuz is not reopened by Tuesday, the US will consider striking key Iranian infrastructure such as power plants and bridges.
At the same time, Iran put forward new negotiating conditions, making it clear that transportation along the strategic waterway could only be restored if a portion of the transit revenue was used to compensate Iran for the losses it suffered due to the war.
Furthermore, Ali Akbar Velayati, an advisor to Iran's new Supreme Leader Mojtaba Khamenei, warned that the resistance front might take action against the Bab el-Mandeb Strait in the Red Sea. This potential risk to this crucial chokepoint has further exacerbated concerns about disruptions to global trade routes and continued to push up crude oil prices.
Strong US non-farm payroll data released last Friday showed that the US labor market remains resilient. This further reinforced market expectations that the Federal Reserve may need to maintain high interest rates for a longer period to combat inflation. The dollar thus received support, while gold faced some selling pressure.
Despite the short-term rebound in gold prices, from a technical perspective, the overall trend has not fundamentally changed.
Currently, gold prices are still trading below the 200-period exponential moving average (currently at 4809), indicating that downward pressure remains in the medium to long term. The MACD indicator shows that its fast line has crossed below the slow line, and both are below the zero line, with the negative histogram continuing to expand, indicating that selling pressure is gradually accumulating. The Relative Strength Index (RSI) is currently hovering around 52; although it is in the neutral range, the pullback from the overbought zone suggests that upward momentum is gradually weakening.
The $4,600 level coincides with the 38.2% Fibonacci retracement of the March decline, making it technically significant. If gold can hold above this level, it may see further recovery; however, a breach could trigger a deeper correction.
On the upside, gold faces its first major resistance level around $4,760, which coincides with the 50.0% Fibonacci retracement level and the recent highs. A strong break above this level would allow bulls to challenge the 200-period moving average around $4,809, and then test the 61.8% retracement level around $4,916. Only a clear recovery above this cluster of moving averages would significantly alleviate the current bearish bias.
On the downside support level, the 38.2% Fibonacci retracement level remains a key short-term support. A break below this level could see prices quickly fall back to around $4412, near the 23.6% retracement level. A further break below this area would put the psychological level of $4300 under immediate scrutiny.
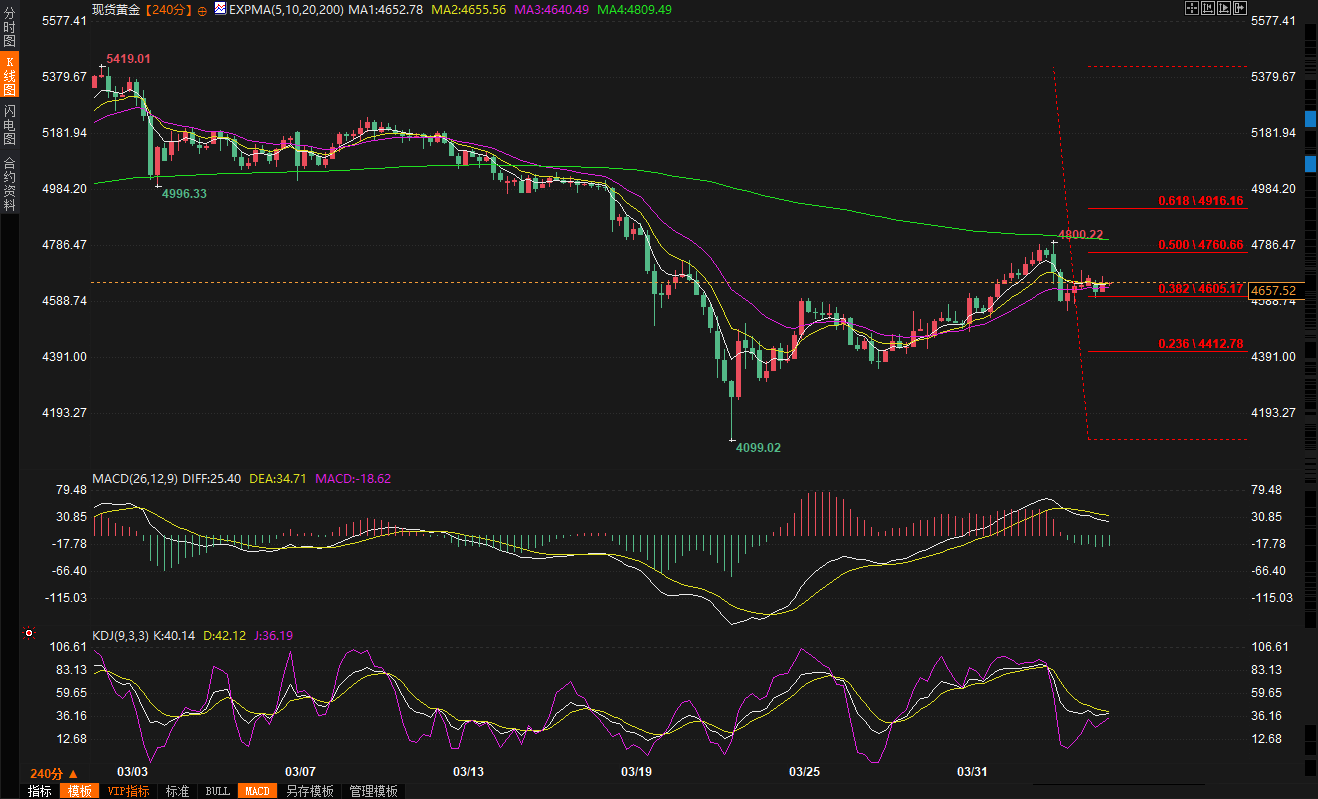
(Spot gold daily chart, source: FX678)
In summary, while the US-Iran ceasefire negotiations provided short-term support for gold, inflation concerns stemming from rising oil prices and expectations that the Federal Reserve will maintain high interest rates continue to exert significant downward pressure on gold bulls. Currently, market liquidity is relatively thin, and coupled with the Easter holiday factor, traders need to remain cautious.
The focus today is on the US ISM Services PMI data, which may provide new directional guidance for the market. With the $4600 level still uncertain, investors need to closely monitor the combined impact of geopolitical factors and macroeconomic data to better grasp the future direction of gold.
At 14:08, spot gold was trading at $4659.01 per ounce in Beijing.
I. Easing geopolitical tensions pressured the dollar, causing gold to temporarily halt its decline and rebound.
During Monday's Asian trading session, gold (XAU/USD) found support near the $4,600 level and rebounded significantly. Although the rebound was limited and follow-up buying was not particularly strong, the movement still injected some confidence into the market.
According to Axios, the United States, Iran, and regional mediators are in in-depth discussions regarding a potential 45-day ceasefire agreement . If reached, this agreement could bring an end to the ongoing conflict. This news directly pressured the safe-haven dollar, thus providing crucial support for gold prices.
However, as a non-yielding asset, gold's upside potential remains significantly constrained by the global interest rate outlook. The market generally believes that war-induced energy price increases could further fuel inflationary pressures, forcing major central banks, including the Federal Reserve, to maintain or even strengthen their tightening policies.
II. Soaring crude oil prices exacerbate inflation concerns, fueling expectations of a longer period of high interest rates from the Federal Reserve.
Investors are currently paying close attention to developments in the energy market. Crude oil prices surged on Monday, hitting a near four-week high. This was largely due to US President Trump's tough stance: if the Strait of Hormuz is not reopened by Tuesday, the US will consider striking key Iranian infrastructure such as power plants and bridges.
At the same time, Iran put forward new negotiating conditions, making it clear that transportation along the strategic waterway could only be restored if a portion of the transit revenue was used to compensate Iran for the losses it suffered due to the war.
Furthermore, Ali Akbar Velayati, an advisor to Iran's new Supreme Leader Mojtaba Khamenei, warned that the resistance front might take action against the Bab el-Mandeb Strait in the Red Sea. This potential risk to this crucial chokepoint has further exacerbated concerns about disruptions to global trade routes and continued to push up crude oil prices.
Strong US non-farm payroll data released last Friday showed that the US labor market remains resilient. This further reinforced market expectations that the Federal Reserve may need to maintain high interest rates for a longer period to combat inflation. The dollar thus received support, while gold faced some selling pressure.
Third, the technical outlook remains weak, with $4,600 becoming a key support/resistance level.
Despite the short-term rebound in gold prices, from a technical perspective, the overall trend has not fundamentally changed.
Currently, gold prices are still trading below the 200-period exponential moving average (currently at 4809), indicating that downward pressure remains in the medium to long term. The MACD indicator shows that its fast line has crossed below the slow line, and both are below the zero line, with the negative histogram continuing to expand, indicating that selling pressure is gradually accumulating. The Relative Strength Index (RSI) is currently hovering around 52; although it is in the neutral range, the pullback from the overbought zone suggests that upward momentum is gradually weakening.
The $4,600 level coincides with the 38.2% Fibonacci retracement of the March decline, making it technically significant. If gold can hold above this level, it may see further recovery; however, a breach could trigger a deeper correction.
IV. Key Support and Resistance Analysis for the Market Outlook
On the upside, gold faces its first major resistance level around $4,760, which coincides with the 50.0% Fibonacci retracement level and the recent highs. A strong break above this level would allow bulls to challenge the 200-period moving average around $4,809, and then test the 61.8% retracement level around $4,916. Only a clear recovery above this cluster of moving averages would significantly alleviate the current bearish bias.
On the downside support level, the 38.2% Fibonacci retracement level remains a key short-term support. A break below this level could see prices quickly fall back to around $4412, near the 23.6% retracement level. A further break below this area would put the psychological level of $4300 under immediate scrutiny.
(Spot gold daily chart, source: FX678)
In summary, caution is still advised regarding the gold price rebound; attention should be paid to the US services PMI data.
In summary, while the US-Iran ceasefire negotiations provided short-term support for gold, inflation concerns stemming from rising oil prices and expectations that the Federal Reserve will maintain high interest rates continue to exert significant downward pressure on gold bulls. Currently, market liquidity is relatively thin, and coupled with the Easter holiday factor, traders need to remain cautious.
The focus today is on the US ISM Services PMI data, which may provide new directional guidance for the market. With the $4600 level still uncertain, investors need to closely monitor the combined impact of geopolitical factors and macroeconomic data to better grasp the future direction of gold.
At 14:08, spot gold was trading at $4659.01 per ounce in Beijing.
- Risk Warning and Disclaimer
- The market involves risk, and trading may not be suitable for all investors. This article is for reference only and does not constitute personal investment advice, nor does it take into account certain users’ specific investment objectives, financial situation, or other needs. Any investment decisions made based on this information are at your own risk.