Is gold poised for a directional breakout amidst triangular compression?
2026-04-06 15:58:42
On Monday, April 6th, spot gold prices fluctuated narrowly around $4660 per ounce, continuing the recent downward pressure. The US dollar index traded around 99.90. Although geopolitical tensions between the US and Iran continued to escalate, market funds flowed more towards the dollar seeking liquidity support than towards traditional safe-haven assets. The latest strong US March non-farm payroll data, coupled with adjustments to the Fed's interest rate path expectations, further limited gold's upside potential. Despite persistent global uncertainties, gold is unlikely to break out of its range-bound trading pattern in the short term.

Tensions between the US and Iran have escalated significantly recently, with the US president publicly warning of potential action against Iranian infrastructure and emphasizing the serious consequences of disrupted shipping through the Strait of Hormuz. Iran has responded strongly, increasing the risk of spillover effects and raising uncertainty in the global energy supply chain. Against this backdrop, oil prices have become more volatile, but gold has not risen as dramatically as traditionally expected.
In the current environment, while geopolitical conflicts increase demand for safe-haven assets, the US dollar's reserve status makes it the preferred safe haven. Capital is flowing out of non-interest-bearing assets like gold and into dollar-denominated instruments with relatively higher yields, partially weakening gold's traditional safe-haven properties. Traders are closely watching developments in the Strait of Hormuz, as any actual disruption could indirectly affect global risk pricing; however, current market reactions indicate that the dollar liquidity premium is dominating short-term sentiment.
The U.S. March nonfarm payrolls report showed an increase of 178,000 jobs, exceeding market expectations, while the unemployment rate fell to 4.3%. This data reflects the resilience of the labor market, which exceeded previous pessimistic forecasts and directly weakened market bets on a near-term interest rate cut by the Federal Reserve.
The US dollar index was thus supported, and the 10-year Treasury yield remained high at around 4.36%. Economic data pushed up real yields, increasing the opportunity cost of holding gold. If employment data continues to be robust, the Federal Reserve will maintain a cautious policy, further suppressing gold valuations.
Spot gold is currently consolidating within a symmetrical triangle pattern, with price highs gradually declining and lows gradually rising, indicating a near balance between bullish and bearish forces, but with narrowing price fluctuations. This pattern is typically accompanied by an accumulation of potential energy, and a breakout above the upper or lower trendline could trigger a significant trend-driven move.
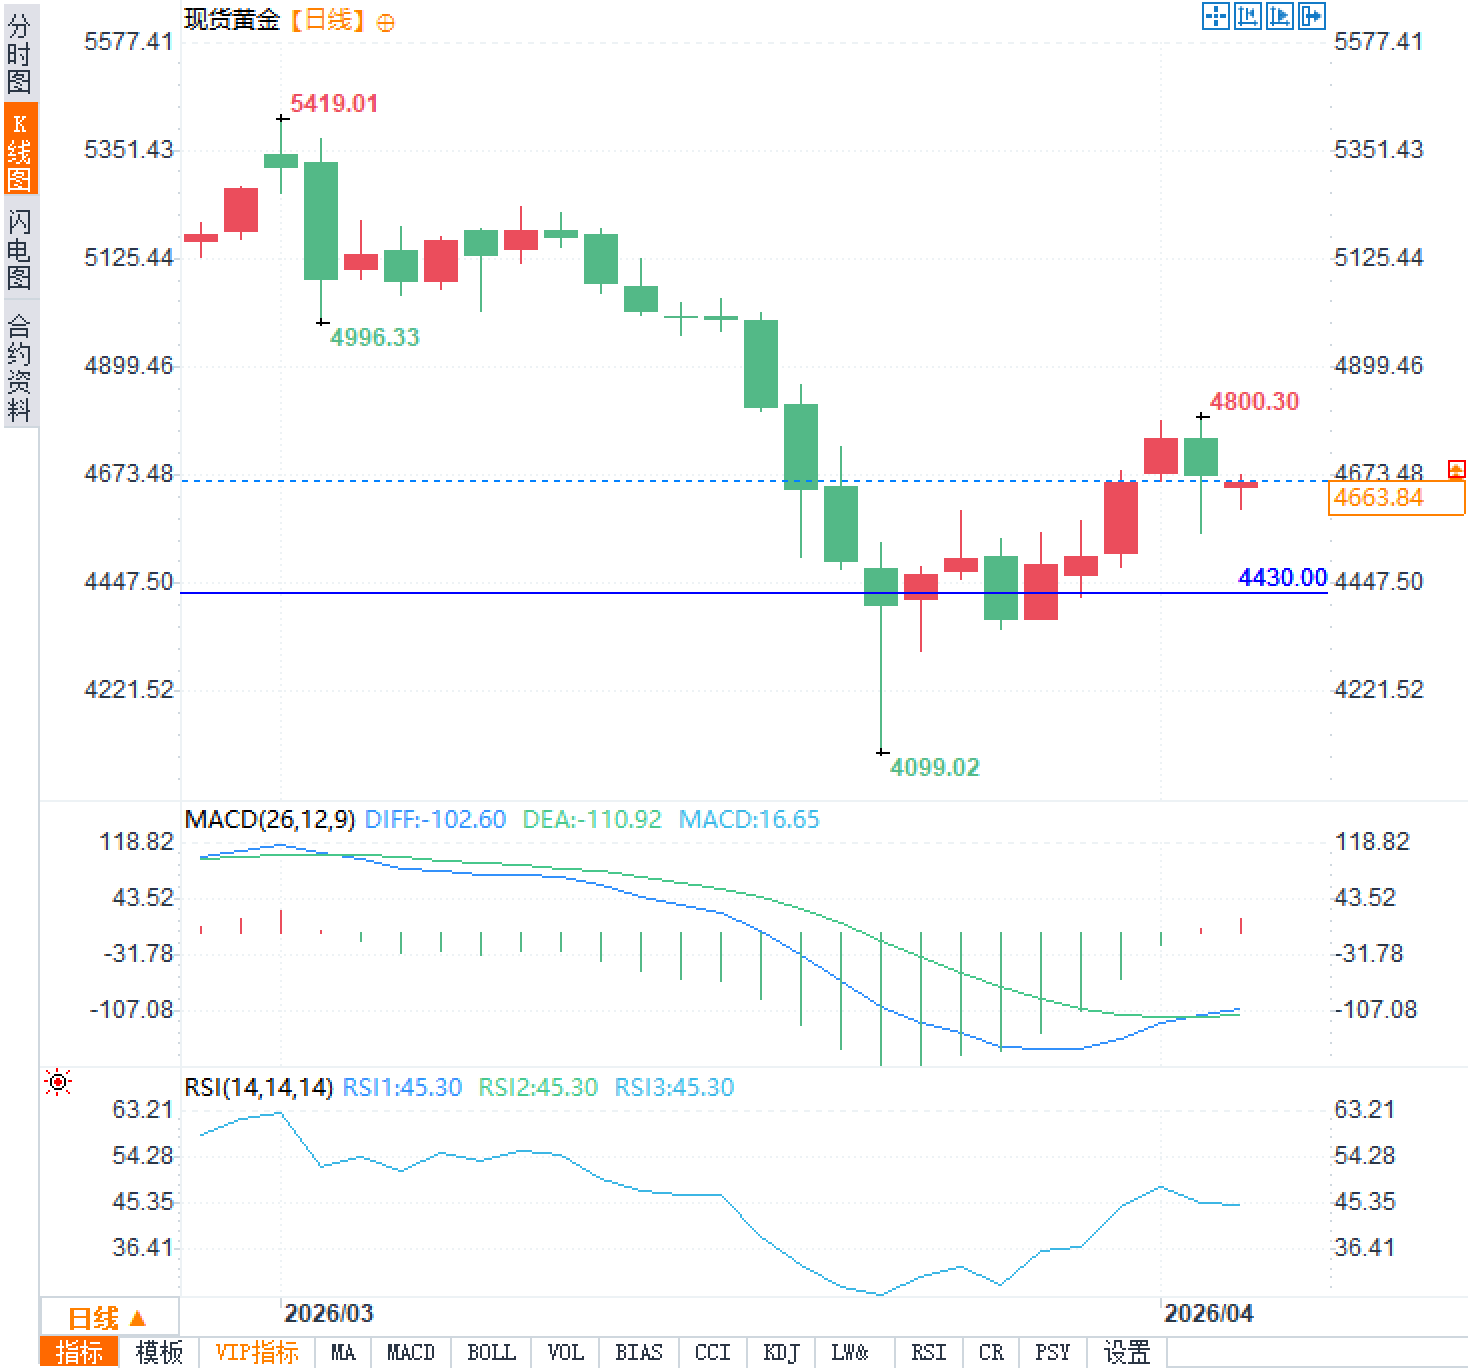
The current price is fluctuating within the $4650-$4700/ounce range with moderate trading volume, and the short-term moving average system is intertwined. Traders are closely monitoring the triangle's trendline; a breakout accompanied by increased volume will confirm the direction. The interplay between geopolitical risks and macroeconomic data is reflected in this technical structure, and any external catalyst could accelerate the breakout process.
The Federal Reserve maintained its target range for the federal funds rate at 3.5% to 3.75% in March, and its dot plot indicates only one rate cut is expected in 2026. Strong employment data further reduced the probability of short-term easing, and the market is pricing in a more consistent "higher and longer" interest rate environment.
This policy path directly increases the real yield of the US dollar, weakening gold's appeal as a non-interest-bearing asset. Traders continue to monitor the latest statements from Federal Reserve officials and inflation data, as any signal of higher-than-expected inflation will reinforce tightening expectations and further limit gold's upside potential. Although geopolitical factors provide some buffer, the pricing logic driven by macroeconomic policy currently prevails.
Diverging Capital Flows Amid Rising Geopolitical Risks
Tensions between the US and Iran have escalated significantly recently, with the US president publicly warning of potential action against Iranian infrastructure and emphasizing the serious consequences of disrupted shipping through the Strait of Hormuz. Iran has responded strongly, increasing the risk of spillover effects and raising uncertainty in the global energy supply chain. Against this backdrop, oil prices have become more volatile, but gold has not risen as dramatically as traditionally expected.
In the current environment, while geopolitical conflicts increase demand for safe-haven assets, the US dollar's reserve status makes it the preferred safe haven. Capital is flowing out of non-interest-bearing assets like gold and into dollar-denominated instruments with relatively higher yields, partially weakening gold's traditional safe-haven properties. Traders are closely watching developments in the Strait of Hormuz, as any actual disruption could indirectly affect global risk pricing; however, current market reactions indicate that the dollar liquidity premium is dominating short-term sentiment.
US economic data supports the dollar and yields.
The U.S. March nonfarm payrolls report showed an increase of 178,000 jobs, exceeding market expectations, while the unemployment rate fell to 4.3%. This data reflects the resilience of the labor market, which exceeded previous pessimistic forecasts and directly weakened market bets on a near-term interest rate cut by the Federal Reserve.
| index | March actual | Market expectations | Previous value |
|---|---|---|---|
| Non-farm payrolls increased (in ten thousand) | 17.8 | Approximately 6.0 | -13.3 |
| unemployment rate(%) | 4.3 | 4.4 | 4.4 |
The technical compression pattern suggests a directional breakout.
Spot gold is currently consolidating within a symmetrical triangle pattern, with price highs gradually declining and lows gradually rising, indicating a near balance between bullish and bearish forces, but with narrowing price fluctuations. This pattern is typically accompanied by an accumulation of potential energy, and a breakout above the upper or lower trendline could trigger a significant trend-driven move.
The current price is fluctuating within the $4650-$4700/ounce range with moderate trading volume, and the short-term moving average system is intertwined. Traders are closely monitoring the triangle's trendline; a breakout accompanied by increased volume will confirm the direction. The interplay between geopolitical risks and macroeconomic data is reflected in this technical structure, and any external catalyst could accelerate the breakout process.
The Fed's policy outlook limits the potential for gold pricing.
The Federal Reserve maintained its target range for the federal funds rate at 3.5% to 3.75% in March, and its dot plot indicates only one rate cut is expected in 2026. Strong employment data further reduced the probability of short-term easing, and the market is pricing in a more consistent "higher and longer" interest rate environment.
This policy path directly increases the real yield of the US dollar, weakening gold's appeal as a non-interest-bearing asset. Traders continue to monitor the latest statements from Federal Reserve officials and inflation data, as any signal of higher-than-expected inflation will reinforce tightening expectations and further limit gold's upside potential. Although geopolitical factors provide some buffer, the pricing logic driven by macroeconomic policy currently prevails.
Frequently Asked Questions
Question 1: What is the core impact of the March non-farm payroll data on gold pricing?
A: The data of 178,000 new jobs and the unemployment rate falling to 4.3% far exceeded expectations, significantly reducing the probability of a Fed rate cut and pushing up the dollar and yields. As a non-interest-bearing asset, gold's opportunity cost has increased, directly limiting its valuation potential.
Question 2: What does the symmetrical triangle pattern mean for short-term trading?
A: This pattern reflects price compression and energy accumulation; a breakout often leads to a directional trend. Traders need to pay attention to a valid breakout of the trendline and confirmation by trading volume to identify potential trend reversals.
- Risk Warning and Disclaimer
- The market involves risk, and trading may not be suitable for all investors. This article is for reference only and does not constitute personal investment advice, nor does it take into account certain users’ specific investment objectives, financial situation, or other needs. Any investment decisions made based on this information are at your own risk.