The Hidden Link Between European LNG Crashes and NYMEX
2026-04-10 16:23:26
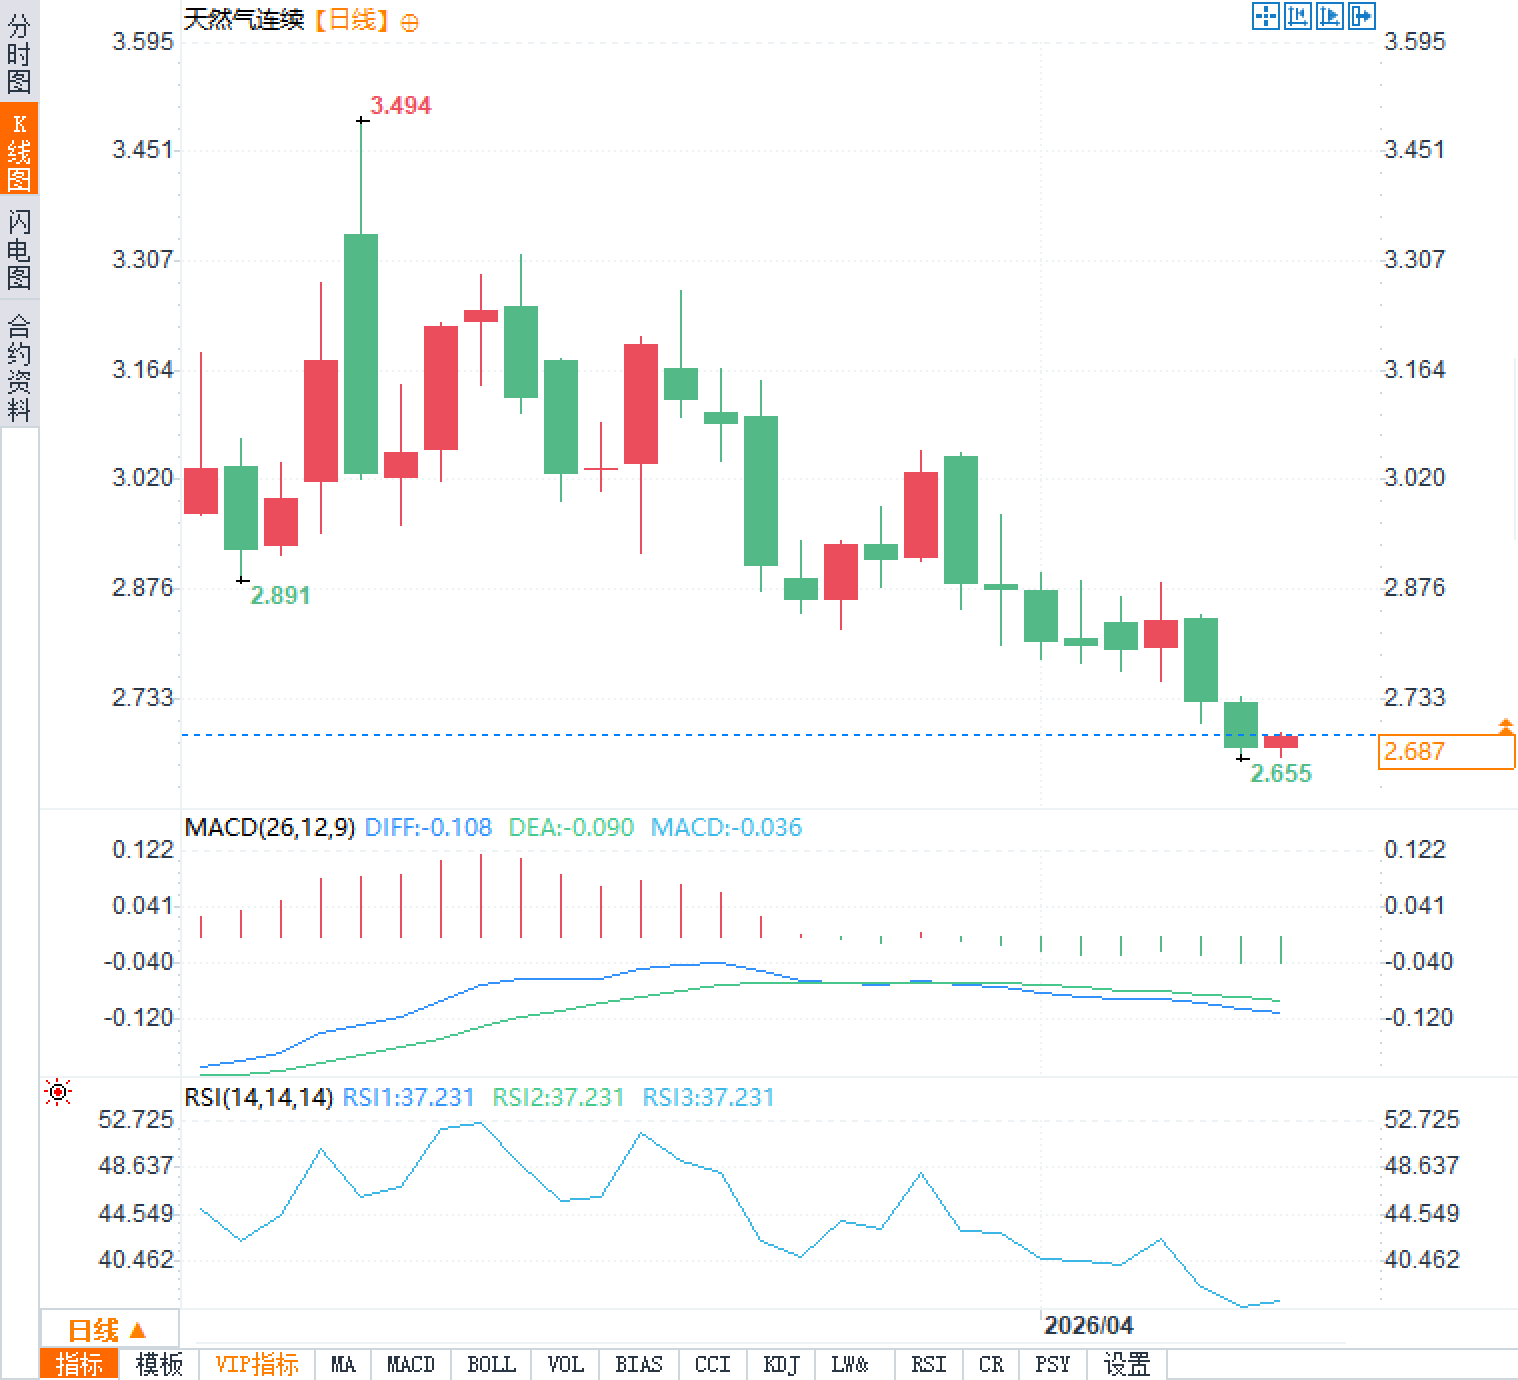
On Friday, April 10th, natural gas contracts on the New York Mercantile Exchange traded around $2.68 per million British thermal units (MMBtu), with limited intraday volatility, exhibiting a low-volatility market. However, structural pressures on the European LNG network are quietly transmitting to the global energy logistics system through channels such as shipping, fuel supply, and terminal concentration. This is due to recent historically low levels of European natural gas storage, while signals of shipping congestion and rising fuel costs have begun to permeate the LNG delivery chain.

Europe's total LNG receiving volume has recently remained at approximately 510 million cubic meters per day, showing a seemingly mild positive trend, but the underlying structure has become oligopolistic. The top three terminals control nearly one-third of the flow, and the Herfindahl-Hirschman index indicates a high degree of concentration. This configuration means limited network resilience, and pressure can easily be transmitted to a few key nodes. Italy recorded no LNG arrivals in the latest data, and Germany's storage levels remain low. The entire system relies on a few coastal hubs to absorb fluctuations, while inland areas depend on the stable output from these hubs.
This apparent stability masks a systemic tightening. Overall European natural gas storage is only around 29%, far below the average for the same period in recent years. Terminal behavior further exposes the pressure points: flow at major volume balancing hubs has expanded significantly, while some traditional hubs have contracted, and other facilities have experienced sudden surges in flow. These changes are not random noise, but rather forced adjustments by the network to maintain equilibrium.
This storage pattern is not a unified buffer, but rather a fragmented and fragile distribution. High storage areas are concentrated in the Iberian Peninsula, while the core consumption areas in Central Europe face significant shortcomings, forcing flows to repeatedly pass through already strained shipping corridors.
Shipping congestion, fuel shortages, and insurance repricing are no longer isolated events, but are directly permeating LNG logistics through transmission channels. Shipping radar shows freight volumes and risk indicators are in extreme stress ranges, with heating oil prices recently rising by more than 4%, and the fuel market facing unprecedented supply pressure. Transmission signal indices show that shipping pressure is actively being transmitted to natural gas prices: crude oil and fuel components are rising, while natural gas futures remain relatively moderate. This divergence reveals a core reality—even though the previous month's contract appears calm, LNG transportation costs are continuing to rise, and the system is absorbing the shock through the logistics end rather than the curve end.
Traders have observed that the pricing logic for natural gas contracts on the New York Mercantile Exchange has shifted from simple commodity supply and demand to assessments of infrastructure resilience. As a major supplier of LNG to Europe, the US is seeing its net export return impacted by rising delivery costs. LNG shipping equities have recently fallen by more than 2.5%, dry bulk has weakened, crude oil tankers have retreated, while product tankers have been relatively resilient. This cross-asset divergence suggests that the market is repricing for access rather than simply availability. While a moderate weakening dollar and declining volatility have provided superficial support for natural gas futures, they have not alleviated operational tensions.
The dynamics at the terminals clearly outline the pressure map. The rapid expansion of volume balance hubs and the contraction of some hubs form a map of the system bending to maintain equilibrium. Currently, the system can absorb shocks through logistics, but once it encounters secondary disturbances, the fragile equilibrium will be tested.
The apparent stability and underlying tightening of European liquefied natural gas flows
Europe's total LNG receiving volume has recently remained at approximately 510 million cubic meters per day, showing a seemingly mild positive trend, but the underlying structure has become oligopolistic. The top three terminals control nearly one-third of the flow, and the Herfindahl-Hirschman index indicates a high degree of concentration. This configuration means limited network resilience, and pressure can easily be transmitted to a few key nodes. Italy recorded no LNG arrivals in the latest data, and Germany's storage levels remain low. The entire system relies on a few coastal hubs to absorb fluctuations, while inland areas depend on the stable output from these hubs.
This apparent stability masks a systemic tightening. Overall European natural gas storage is only around 29%, far below the average for the same period in recent years. Terminal behavior further exposes the pressure points: flow at major volume balancing hubs has expanded significantly, while some traditional hubs have contracted, and other facilities have experienced sudden surges in flow. These changes are not random noise, but rather forced adjustments by the network to maintain equilibrium.
| nation | Natural gas storage rate (%) |
|---|---|
| Portugal | More than 90 |
| Spain | Approximately 57 |
| Italy | 44 |
| Germany | twenty three |
Transmission mechanism of shipping and fuel pressures to the natural gas market
Shipping congestion, fuel shortages, and insurance repricing are no longer isolated events, but are directly permeating LNG logistics through transmission channels. Shipping radar shows freight volumes and risk indicators are in extreme stress ranges, with heating oil prices recently rising by more than 4%, and the fuel market facing unprecedented supply pressure. Transmission signal indices show that shipping pressure is actively being transmitted to natural gas prices: crude oil and fuel components are rising, while natural gas futures remain relatively moderate. This divergence reveals a core reality—even though the previous month's contract appears calm, LNG transportation costs are continuing to rise, and the system is absorbing the shock through the logistics end rather than the curve end.
Traders have observed that the pricing logic for natural gas contracts on the New York Mercantile Exchange has shifted from simple commodity supply and demand to assessments of infrastructure resilience. As a major supplier of LNG to Europe, the US is seeing its net export return impacted by rising delivery costs. LNG shipping equities have recently fallen by more than 2.5%, dry bulk has weakened, crude oil tankers have retreated, while product tankers have been relatively resilient. This cross-asset divergence suggests that the market is repricing for access rather than simply availability. While a moderate weakening dollar and declining volatility have provided superficial support for natural gas futures, they have not alleviated operational tensions.
The dynamics at the terminals clearly outline the pressure map. The rapid expansion of volume balance hubs and the contraction of some hubs form a map of the system bending to maintain equilibrium. Currently, the system can absorb shocks through logistics, but once it encounters secondary disturbances, the fragile equilibrium will be tested.
Frequently Asked Questions
Question 1: Why does the apparent stability of liquefied natural gas flows in Europe mask a systemic tightening?
A: While daily port arrivals appear to remain above 500 million cubic meters, the high concentration of the top three terminals and fragmented storage distribution (Portugal at a high level while Germany is only 23%) result in insufficient network resilience, with pressure concentrated on a few hubs. Rising shipping and fuel costs further amplify this structural vulnerability; the current price calm actually stems from the logistics sector absorbing shocks rather than from supply and demand equilibrium.
Question 2: How does shipping pressure affect the pricing of natural gas contracts on the New York Mercantile Exchange through transmission mechanisms?
A: The transmission signal index shows that fuel shortages and congestion are directly driving up delivery costs, and even with a moderate futures curve, actual logistics expenses have increased. Traders are shifting from commodities to infrastructure-resilient pricing, putting pressure on the netback of US LNG exports to Europe and indirectly affecting the global linkage of the Henry Hub benchmark.
- Risk Warning and Disclaimer
- The market involves risk, and trading may not be suitable for all investors. This article is for reference only and does not constitute personal investment advice, nor does it take into account certain users’ specific investment objectives, financial situation, or other needs. Any investment decisions made based on this information are at your own risk.