A backwardation of $91.5/ton! What signals a dramatic shift in the aluminum market structure?
2026-04-13 17:57:27
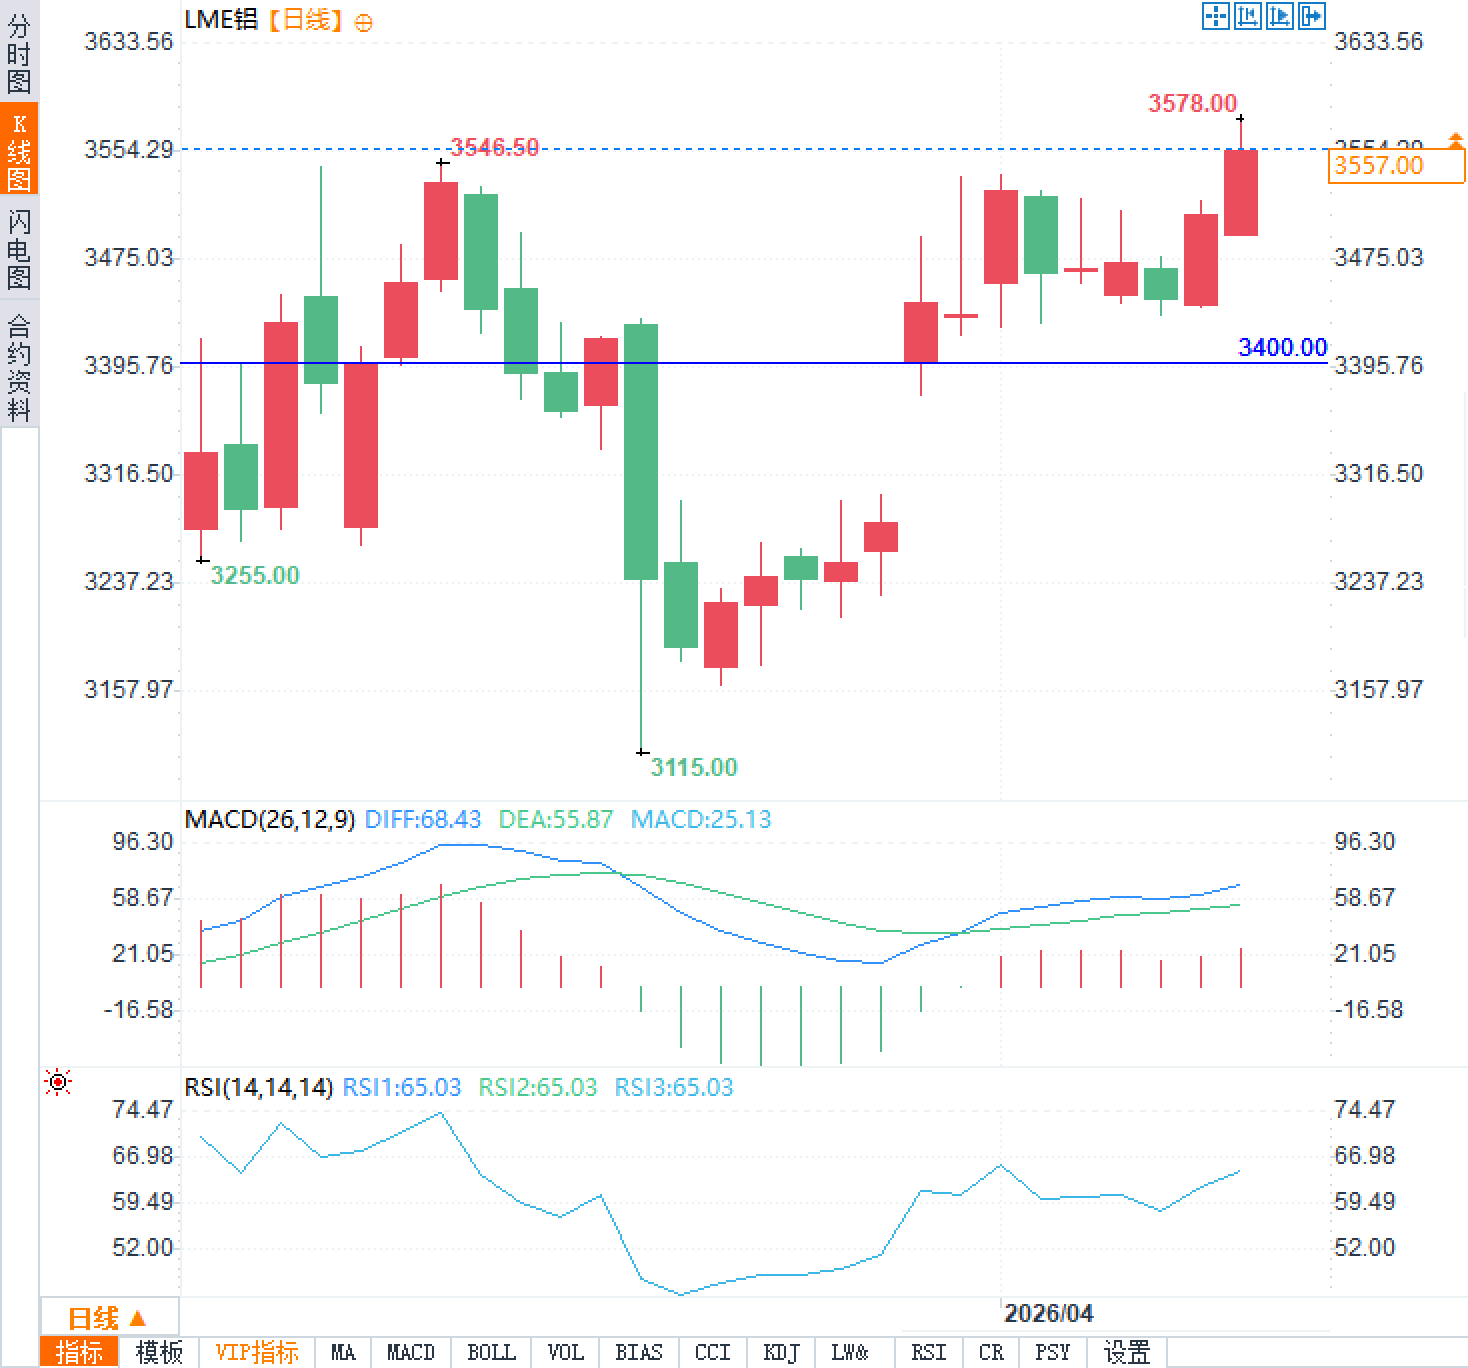
On Monday, April 13th, LME aluminum prices continued their strong performance, with the three-month contract trading around $3550 per tonne, a daily increase of over 1%, reaching a near four-year high. Geopolitical risks continued to escalate in the Middle East, leading to a sharp increase in market concerns about supply disruptions to bauxite transport routes and smelting capacity. Related US policy measures exacerbated shipping uncertainty in the Strait of Hormuz, further fueling tensions in the spot market. Global aluminum inventories remained relatively low, and high energy prices provided additional support for smelting costs. Meanwhile, other industrial metal prices weakened due to concerns about the global growth outlook, and speculative positions generally became more cautious.

The Middle East, a major source of global aluminum production, accounts for approximately 9% of global output and is a key supplier to major consuming markets such as Europe. Recent disruptions to smelter facilities in the region, coupled with shipping disruptions in the Strait of Hormuz, have directly tightened aluminum ingot export flows. Any sustained transport disruptions will amplify regional premiums, especially given the current tight inventory levels. Traders should note that this supply-side shock differs from demand-driven cyclical fluctuations; it represents a structural supply bottleneck that is difficult to quickly address in the short term through other producing regions. Historical data shows that similar transport corridor risks often lead to rapid destocking in the spot market, thereby pushing up LME benchmark prices. Currently, aluminum prices have risen significantly from initial conflict levels, reflecting a repricing of medium- to long-term supply security. In contrast, as a base industrial metal, aluminum has broad downstream applications in transportation, construction, and packaging; any supply uncertainty will quickly translate into end-user costs.
The LME spot price spread between the spot and three-month contracts has sharply shifted from a small positive spread at the beginning of the conflict to a deep inverse spread, widening to $91.5/ton, the strongest level since 2007. This structural change clearly indicates extremely tight supply in the near-month contracts and relatively loose supply in the far-month contracts. The widening of the inverse spread has not only attracted spot holders to avoid delivery but also prompted traders to actively close the spread for arbitrage, but the overall inventory release is lagging behind demand expectations. The following is a comparison of key recent LME aluminum data:
This market structure means a significant near-month liquidity premium for traders, increased physical delivery risk, and a cost buffer for smelters holding inventory. However, if the backwardation continues to widen, it could further stimulate arbitrage inflows, supporting price resilience in the short term.
Aluminum smelting is an energy-intensive industry, with electricity and natural gas costs accounting for 30%-40% of total production costs. Recent increases in oil and gas prices due to geopolitical factors have directly pushed up the floor of the global aluminum cost curve. Even with increased volatility in the electricity market in some producing regions, overall energy prices still provide a price floor for marginal capacity. Traders have observed that, under the combined effect of cost support and supply disruptions, aluminum prices are significantly more resilient than other cyclical metals. While the global growth outlook faces inflationary pressures from high oil prices, downstream demand for aluminum remains relatively resilient, especially in infrastructure and green transition sectors. However, if energy prices rise further beyond fundamentals, it could indirectly weaken end-consumer willingness, creating a demand-side backlash. Overall, energy factors currently remain a crucial fundamental anchor for aluminum price increases, rather than simply being driven by speculation.
While aluminum prices led the gains, other industrial metals showed significant divergence. Copper and zinc, with their more cyclical nature, weakened due to declining global growth expectations. The latest CFTC data shows that speculators are becoming more cautious with their positions in industrial metals: COMEX copper net long positions fell to 38,804 contracts as of April 7, a decrease of 488 contracts from the previous week, indicating increased risk from both long and short positions; silver net long positions further decreased by 777 contracts to 10,039 contracts, mainly due to a decline in long positions. This position adjustment reflects the market's balance of risks on both sides, rather than a one-sided bullish outlook. Aluminum's relative strength stems from its unique supply-side vulnerability, contrasting sharply with the demand-driven logic of other metals. Traders should note that this divergence may continue until next week's data release; if the backwardation structure persists, aluminum is likely to remain independent of the overall commodity market trend.
Geopolitical risks drive aluminum prices up rapidly
The Middle East, a major source of global aluminum production, accounts for approximately 9% of global output and is a key supplier to major consuming markets such as Europe. Recent disruptions to smelter facilities in the region, coupled with shipping disruptions in the Strait of Hormuz, have directly tightened aluminum ingot export flows. Any sustained transport disruptions will amplify regional premiums, especially given the current tight inventory levels. Traders should note that this supply-side shock differs from demand-driven cyclical fluctuations; it represents a structural supply bottleneck that is difficult to quickly address in the short term through other producing regions. Historical data shows that similar transport corridor risks often lead to rapid destocking in the spot market, thereby pushing up LME benchmark prices. Currently, aluminum prices have risen significantly from initial conflict levels, reflecting a repricing of medium- to long-term supply security. In contrast, as a base industrial metal, aluminum has broad downstream applications in transportation, construction, and packaging; any supply uncertainty will quickly translate into end-user costs.
The spot market structure is shifting towards a deep backwardation.
The LME spot price spread between the spot and three-month contracts has sharply shifted from a small positive spread at the beginning of the conflict to a deep inverse spread, widening to $91.5/ton, the strongest level since 2007. This structural change clearly indicates extremely tight supply in the near-month contracts and relatively loose supply in the far-month contracts. The widening of the inverse spread has not only attracted spot holders to avoid delivery but also prompted traders to actively close the spread for arbitrage, but the overall inventory release is lagging behind demand expectations. The following is a comparison of key recent LME aluminum data:
| index | Latest value | Changes from the beginning of the month | Remark |
|---|---|---|---|
| Three-month contract price (USD/ton) | 3550 | + Approximately 150 | Near a four-year high |
| Spot-Three-Month Price Spread (USD/ton) | 91.5 | From positive 12 to negative 91.5 | The strongest backwardation since 2007 |
| LME Registered Inventory (tons) | Approximately 400,000 | Slight increase but still low | No significant replenishment observed |
High energy prices strengthen support for smelting costs
Aluminum smelting is an energy-intensive industry, with electricity and natural gas costs accounting for 30%-40% of total production costs. Recent increases in oil and gas prices due to geopolitical factors have directly pushed up the floor of the global aluminum cost curve. Even with increased volatility in the electricity market in some producing regions, overall energy prices still provide a price floor for marginal capacity. Traders have observed that, under the combined effect of cost support and supply disruptions, aluminum prices are significantly more resilient than other cyclical metals. While the global growth outlook faces inflationary pressures from high oil prices, downstream demand for aluminum remains relatively resilient, especially in infrastructure and green transition sectors. However, if energy prices rise further beyond fundamentals, it could indirectly weaken end-consumer willingness, creating a demand-side backlash. Overall, energy factors currently remain a crucial fundamental anchor for aluminum price increases, rather than simply being driven by speculation.
Industrial metals diverge and speculative positions are cautiously adjusted.
While aluminum prices led the gains, other industrial metals showed significant divergence. Copper and zinc, with their more cyclical nature, weakened due to declining global growth expectations. The latest CFTC data shows that speculators are becoming more cautious with their positions in industrial metals: COMEX copper net long positions fell to 38,804 contracts as of April 7, a decrease of 488 contracts from the previous week, indicating increased risk from both long and short positions; silver net long positions further decreased by 777 contracts to 10,039 contracts, mainly due to a decline in long positions. This position adjustment reflects the market's balance of risks on both sides, rather than a one-sided bullish outlook. Aluminum's relative strength stems from its unique supply-side vulnerability, contrasting sharply with the demand-driven logic of other metals. Traders should note that this divergence may continue until next week's data release; if the backwardation structure persists, aluminum is likely to remain independent of the overall commodity market trend.
- Risk Warning and Disclaimer
- The market involves risk, and trading may not be suitable for all investors. This article is for reference only and does not constitute personal investment advice, nor does it take into account certain users’ specific investment objectives, financial situation, or other needs. Any investment decisions made based on this information are at your own risk.