Institutions: Gold and silver both issued bearish signals in March; bull market restart may have to wait another six months.
2026-04-14 11:23:29
According to a recent report from Heraeus, a globally renowned precious metals analysis firm, both gold and silver released relatively clear bearish signals in March, suggesting that a full-scale restart of the precious metals bull market may still be about six months away. Despite news of sovereign wealth fund sales and swap transactions in the market, central banks around the world have generally maintained a net buying stance on gold.

Heraus analysts noted in their report that the Federal Reserve is currently facing a difficult choice regarding interest rate policy.
They wrote, "With prices continuing to rise and job growth stalling, the Federal Reserve must strike a balance between its dual mandate of supporting maximum employment and maintaining price stability." Even if a ceasefire is achieved in the Middle East, inflation is likely to remain high for some time, meaning the Fed is more likely to keep interest rates unchanged or even consider further rate hikes.
U.S. nonfarm payrolls increased by 178,000 in March, significantly exceeding market expectations of 118,000. However, according to data from the U.S. Bureau of Labor Statistics, in the past 12 months starting from January 2025, employment data for 11 months has been revised downward, with an average revision of -51,000.
Analysts added, "Since the recovery from the COVID-19 pandemic in late 2024, total U.S. nonfarm payrolls have remained relatively stagnant. If rising costs lead to slower economic growth, this will negatively impact the job market, and a weaker job market could force the Federal Reserve to lower the federal funds rate to stimulate the economy and employment."
Furthermore, the probability of one or two interest rate cuts in 2026 had risen to 27.3% on April 9, a significant increase from 14.1% before the ceasefire agreement was announced on April 7.
Analysts said, "The initial market reaction to the ceasefire news was a rebound in previously sold-off assets, while previously rising commodities (energy, the US dollar) retreated. This news boosted precious metal prices, helping them to close higher at the end of last week."
The report shows that central banks around the world continued to be net buyers of gold in February, with global central banks purchasing a net 27 tons of gold that month, up from 5 tons in January.
The National Bank of Poland increased its gold holdings by 20.2 tons in February, the largest monthly increase since February 2025 (29 tons). Uzbekistan increased its holdings by 7.8 tons, and Kazakhstan by 7.7 tons. The main sellers were Turkey (reducing its holdings by 8.1 tons) and Russia (reducing its holdings by 6.2 tons).
This trend continues the long-standing pattern of central banks accumulating gold since the global financial crisis. In 2025, global central banks added a total of 863 tons of gold to their reserves.
Herous analysts pointed out that gold formed a typical bearish engulfing pattern on the monthly chart last month: the opening price in March was higher than the previous month, but the closing price was lower than the previous month's closing price. This pattern coincides closely with the timing of the end of January when the bull market in precious metals stalled and the start of the US-Israeli military action against Iran.
Historically, after a similar bearish engulfing pattern appeared in April 2022, gold prices fell for six consecutive months, from $2,000 per ounce to $1,600 per ounce.
Analysts believe that despite similar price action, the current pullback could be absorbed by the ongoing bull market trend, as higher inflation and lower real interest rates will continue to support gold demand. However, if last week's upward trend reverses, the next key support level could be near the March lows, around $4,100 per ounce.
Helaus analysts pointed out that sales of physical silver bars and coins saw a significant decline in March. The Perth Mint sold 976,450 ounces in March, a sharp drop from the nearly 2 million ounces high in February. However, total silver sales in the first quarter exceeded 4.6 million ounces, a significantly stronger start to 2026 than in 2025.
Sales of American Eagle silver coins by the U.S. Mint also fell slightly from 1.7 million ounces in February to 1.6 million ounces in March, with total sales for the first three months exceeding 8.1 million ounces, significantly higher than the 5.3 million ounces in the same period last year.
From a technical perspective, the monthly chart for silver also shows a bearish engulfing pattern similar to that of gold. Analysts say this means that silver prices may consolidate or trend weakly for several months before the bull market resumes.
Despite the temporary positive impact of the Middle East ceasefire, technical signals for gold and silver in March remain cautious. Heraus analysts believe the restart of the precious metals bull market may be delayed by at least six months. During this period, continued gold purchases by central banks will act as a crucial support, while the Federal Reserve's interest rate decisions and global inflation trends will continue to dominate the medium-term direction of the precious metals market.
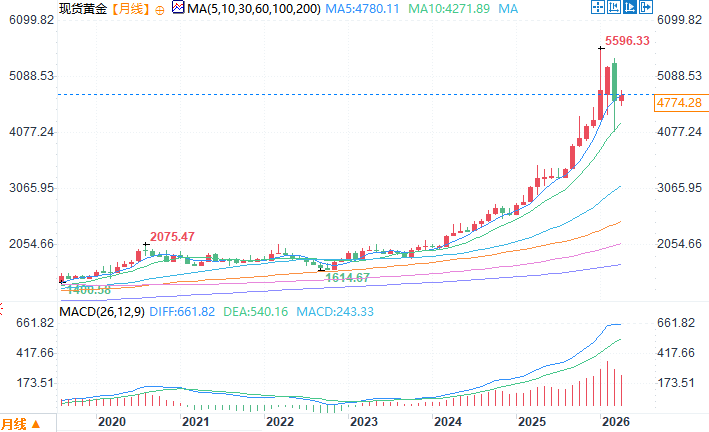
Spot gold monthly chart source: EasyForex
At 11:23 AM Beijing time on April 14, spot gold was trading at $4769.28 per ounce.
The Fed's policy dilemma: How to balance employment and inflation?
Heraus analysts noted in their report that the Federal Reserve is currently facing a difficult choice regarding interest rate policy.
They wrote, "With prices continuing to rise and job growth stalling, the Federal Reserve must strike a balance between its dual mandate of supporting maximum employment and maintaining price stability." Even if a ceasefire is achieved in the Middle East, inflation is likely to remain high for some time, meaning the Fed is more likely to keep interest rates unchanged or even consider further rate hikes.
U.S. nonfarm payrolls increased by 178,000 in March, significantly exceeding market expectations of 118,000. However, according to data from the U.S. Bureau of Labor Statistics, in the past 12 months starting from January 2025, employment data for 11 months has been revised downward, with an average revision of -51,000.
Analysts added, "Since the recovery from the COVID-19 pandemic in late 2024, total U.S. nonfarm payrolls have remained relatively stagnant. If rising costs lead to slower economic growth, this will negatively impact the job market, and a weaker job market could force the Federal Reserve to lower the federal funds rate to stimulate the economy and employment."
Furthermore, the probability of one or two interest rate cuts in 2026 had risen to 27.3% on April 9, a significant increase from 14.1% before the ceasefire agreement was announced on April 7.
The ceasefire announcement triggered a brief market rebound.
Analysts said, "The initial market reaction to the ceasefire news was a rebound in previously sold-off assets, while previously rising commodities (energy, the US dollar) retreated. This news boosted precious metal prices, helping them to close higher at the end of last week."
The central bank continued to buy gold, with a net increase of 27 tons in February.
The report shows that central banks around the world continued to be net buyers of gold in February, with global central banks purchasing a net 27 tons of gold that month, up from 5 tons in January.
The National Bank of Poland increased its gold holdings by 20.2 tons in February, the largest monthly increase since February 2025 (29 tons). Uzbekistan increased its holdings by 7.8 tons, and Kazakhstan by 7.7 tons. The main sellers were Turkey (reducing its holdings by 8.1 tons) and Russia (reducing its holdings by 6.2 tons).
This trend continues the long-standing pattern of central banks accumulating gold since the global financial crisis. In 2025, global central banks added a total of 863 tons of gold to their reserves.
Gold Technical Analysis: Bearish Engulfing Pattern Formed in March
Herous analysts pointed out that gold formed a typical bearish engulfing pattern on the monthly chart last month: the opening price in March was higher than the previous month, but the closing price was lower than the previous month's closing price. This pattern coincides closely with the timing of the end of January when the bull market in precious metals stalled and the start of the US-Israeli military action against Iran.
Historically, after a similar bearish engulfing pattern appeared in April 2022, gold prices fell for six consecutive months, from $2,000 per ounce to $1,600 per ounce.
Analysts believe that despite similar price action, the current pullback could be absorbed by the ongoing bull market trend, as higher inflation and lower real interest rates will continue to support gold demand. However, if last week's upward trend reverses, the next key support level could be near the March lows, around $4,100 per ounce.
Silver Market: Physical sales declined, but the first quarter was still stronger than last year.
Helaus analysts pointed out that sales of physical silver bars and coins saw a significant decline in March. The Perth Mint sold 976,450 ounces in March, a sharp drop from the nearly 2 million ounces high in February. However, total silver sales in the first quarter exceeded 4.6 million ounces, a significantly stronger start to 2026 than in 2025.
Sales of American Eagle silver coins by the U.S. Mint also fell slightly from 1.7 million ounces in February to 1.6 million ounces in March, with total sales for the first three months exceeding 8.1 million ounces, significantly higher than the 5.3 million ounces in the same period last year.
From a technical perspective, the monthly chart for silver also shows a bearish engulfing pattern similar to that of gold. Analysts say this means that silver prices may consolidate or trend weakly for several months before the bull market resumes.
Summarize
Despite the temporary positive impact of the Middle East ceasefire, technical signals for gold and silver in March remain cautious. Heraus analysts believe the restart of the precious metals bull market may be delayed by at least six months. During this period, continued gold purchases by central banks will act as a crucial support, while the Federal Reserve's interest rate decisions and global inflation trends will continue to dominate the medium-term direction of the precious metals market.
Spot gold monthly chart source: EasyForex
At 11:23 AM Beijing time on April 14, spot gold was trading at $4769.28 per ounce.
- Risk Warning and Disclaimer
- The market involves risk, and trading may not be suitable for all investors. This article is for reference only and does not constitute personal investment advice, nor does it take into account certain users’ specific investment objectives, financial situation, or other needs. Any investment decisions made based on this information are at your own risk.