Gold futures outlook: The rally has slowed near $5,000, and bearish signals are gradually emerging.
2026-04-16 18:49:12
Gold prices rose and then fell during the European session on Thursday (April 16). Spot gold was trading at $4,807.37 per ounce, while gold futures were trading at $4,828.6 per ounce, a gain of 0.10%. Gold is about to achieve its fourth consecutive week of gains, with this rebound accumulating an 18% increase since the 50-week exponential moving average (EMA) was established, initially injecting optimism into the market. However, current market performance shows a clear weakening of upward momentum, a subtle shift in fund positioning, and the resistance effect of key levels, all indicating that this rebound may be nearing its end, and the risk of a short-term correction is rapidly accumulating.
While gold is poised for its fourth consecutive week of gains, making it one of the more outstanding performers in the recent commodities market, a closer look reveals clear signs of fatigue in this rebound: not only has it taken longer than previous upward cycles, but the recovery so far is less than half of the previous 27% drop. Combined with macroeconomic factors such as the unclear shift in expectations regarding the Federal Reserve's policy and a slight recovery in global risk appetite, gold's further upside potential may be limited, and a period of correction is even possible at any time.
Gold futures technical analysis: Gold prices approach $5,000, rally stalls, momentum weakens.
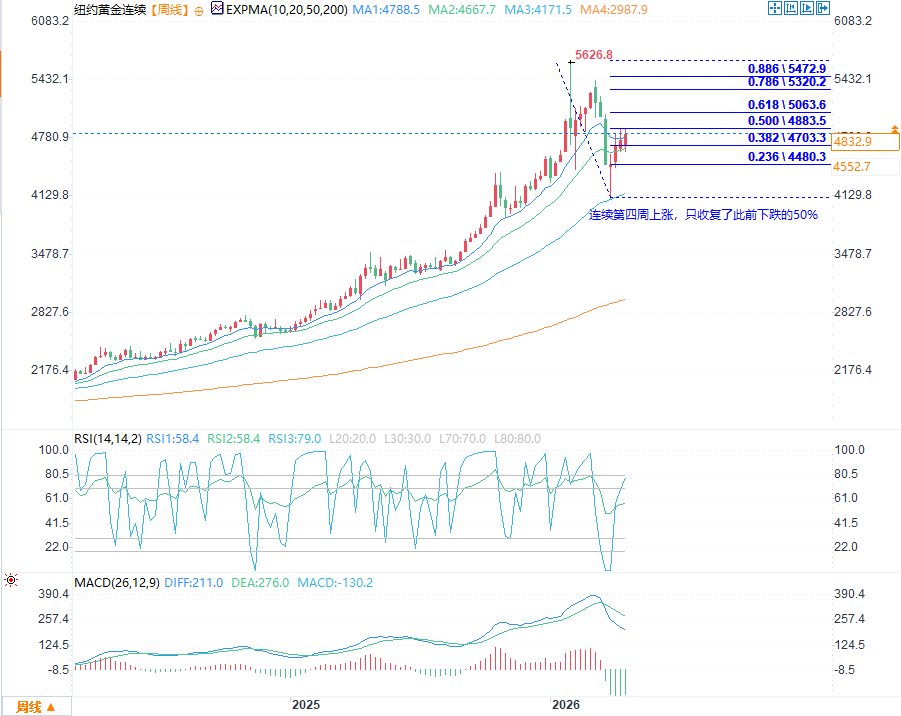
(COMEX Gold Week chart source: EasyForex)
Looking back at recent price movements, after reaching a record high in late January, gold prices experienced a rapid decline, falling by as much as 27%, briefly entering a technical bear market, influenced by multiple factors such as declining inflation data and a strengthening US dollar index. However, after touching the key medium- to long-term support level of the 50-week exponential moving average (EMA), bulls began to mount a counterattack, driving gold prices to rebound by 18%. It is currently poised for its fourth consecutive week of gains, and market enthusiasm for buying has briefly recovered.
Even so, the pace of this recovery has been noticeably slow. Compared to the rapid decline in the previous period, the rebound has seen multiple instances of "surges followed by pullbacks," and prices have not yet rebounded to 50% of the previous decline (a key Fibonacci retracement level). Furthermore, momentum indicators suggest that upward momentum is gradually waning. Especially as gold prices approach the psychologically significant $5,000 mark, the bulls lack the drive for sustained upward movement and must remain highly cautious. It is also worth noting that this week's high for gold prices encountered resistance near the February lows, a level that has now become resistance after previously acting as significant support, further reinforcing the short-term downward pressure.
A potential double top pattern has formed near $5,000, indicating weakening upward momentum.
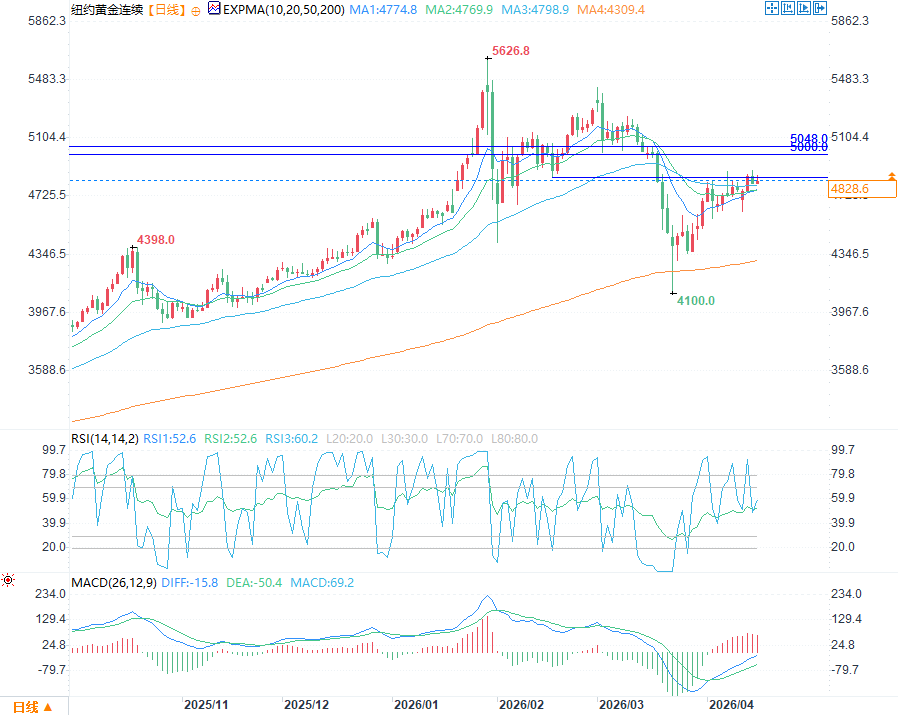
(COMEX Gold Daily Chart Source: FX678)
Observing the daily chart, gold prices have formed a potential double top pattern near the February low ($4,842) - this classic reversal pattern usually signifies the end of an uptrend, sounding an alarm for bulls; at the same time, the small bearish candlestick on Wednesday, with the price falling back just below the 50-day moving average, shows that short-term moving average support has turned into resistance, and the bulls' advance has been thwarted.
The indicators also send warning signals: the short-term RSI (2-period) shows a slight bearish divergence, meaning that the price has made a new high but the indicator has not risen in tandem, suggesting insufficient upward momentum; the 14-period RSI is also at risk of falling below the 50 midline, and once this position is breached, it will further confirm the weakening of the short-term upward trend.
Despite some technical uncertainties, and the possibility of gold prices continuing to rise slightly driven by capital inflows, the author believes that the top is near – most likely within the current price range, or after a slight upward test of the $5,000 psychological level and the high-volume level (HVN) at $5,048 before forming a top. The $5,048 level, as a high-volume level, represents a significant concentration of buying and selling activity; failure to break through it effectively will become a major resistance level limiting further upward movement in gold prices.
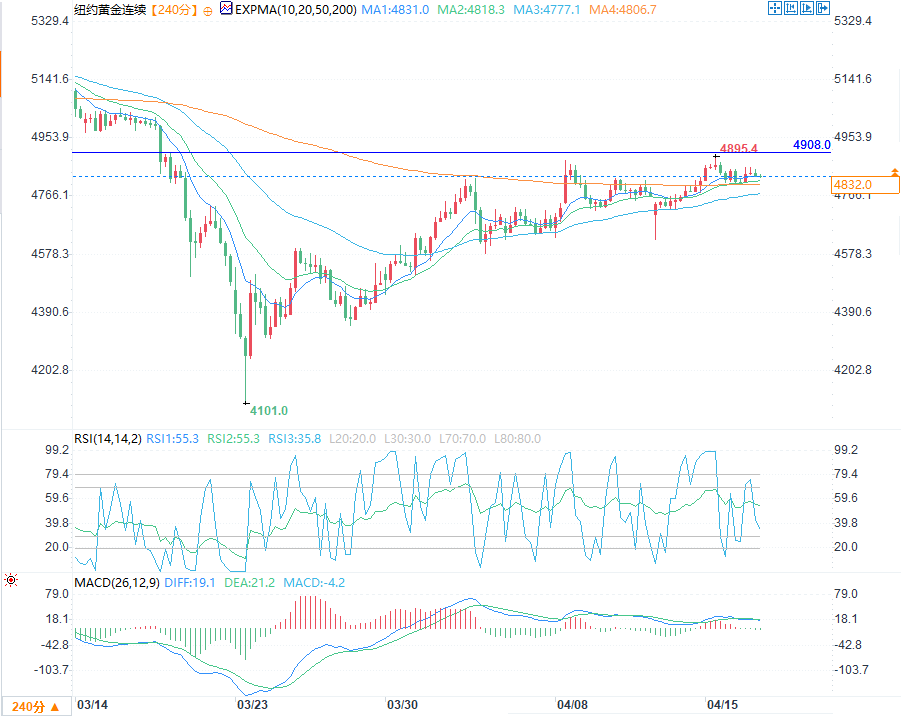
(COMEX Gold 4-hour chart source: EasyForex)
From the 4-hour chart, the potential double-top pattern coincides with the first resistance level (R1) on the weekly chart, further amplifying the short-term downside risk. Gold prices have now slightly retreated and are temporarily stabilizing in a dense area of multiple moving averages (5-day, 10-day, and 20-day). A slight rebound is possible in the short term, but given the overall lack of upward momentum, the rebound is expected to be limited and unlikely to change the short-term weak trend.
Key Trading Ideas
Based on technical chart patterns and key price levels, the following trading logic is provided for reference:
Short sellers tend to place short orders at Wednesday's high (around $4,842), with the key target at the weekly pivot point of $4,766. This level serves as a short-term dividing line between bullish and bearish sentiment; a break below it would open up further downside potential.
If gold prices break below $4,766, the next key levels to watch are the first weekly support level (S1) and the psychological level of $4,600. These levels have provided support multiple times during the previous rebound and are therefore of technical significance.
If the bulls unexpectedly gain momentum and break through the weekly resistance of $4,908 (R1), the short-term bearish view will be invalidated, and the gold price will once again challenge the $5,000 mark.
If gold prices reach $5,000, given the significant psychological resistance at this level and the pressure from previously trapped positions, it is highly likely to form a temporary high. At that time, opportunities for short sellers to re-enter the market may be worth watching.
Gold Futures Position Analysis (COT Report)
The positioning data further confirms the downward pressure on gold prices in the short term. According to the latest COT report released by the CFTC, large speculators' net long positions in gold have declined for the second consecutive week, while asset management institutions have reduced their net long positions for the third consecutive week. It is worth noting that although gold prices experienced a significant surge at the end of 2025, overall net long positions have already shown a continuous downward trend, reflecting a gradual weakening of institutional investors' confidence in the medium- to long-term upward trend of gold.
A more crucial signal is that since December 2025, asset management institutions have been gradually increasing their short positions, and last week large speculators also increased their short positions again. Although current data suggests that the increase in short positions is not enough to completely reverse the overall bullish market trend, this trend resonates with bearish signals from the technical indicators—gold is likely to be approaching a turning point, and subsequent market movements may favor a bearish stance. The continued accumulation of institutional short positions indicates that market divergence regarding future gold price increases is widening, and safe-haven demand has cooled, further weakening the upward momentum of gold prices.
While gold is poised for its fourth consecutive week of gains, making it one of the more outstanding performers in the recent commodities market, a closer look reveals clear signs of fatigue in this rebound: not only has it taken longer than previous upward cycles, but the recovery so far is less than half of the previous 27% drop. Combined with macroeconomic factors such as the unclear shift in expectations regarding the Federal Reserve's policy and a slight recovery in global risk appetite, gold's further upside potential may be limited, and a period of correction is even possible at any time.
Gold futures technical analysis: Gold prices approach $5,000, rally stalls, momentum weakens.
(COMEX Gold Week chart source: EasyForex)
Looking back at recent price movements, after reaching a record high in late January, gold prices experienced a rapid decline, falling by as much as 27%, briefly entering a technical bear market, influenced by multiple factors such as declining inflation data and a strengthening US dollar index. However, after touching the key medium- to long-term support level of the 50-week exponential moving average (EMA), bulls began to mount a counterattack, driving gold prices to rebound by 18%. It is currently poised for its fourth consecutive week of gains, and market enthusiasm for buying has briefly recovered.
Even so, the pace of this recovery has been noticeably slow. Compared to the rapid decline in the previous period, the rebound has seen multiple instances of "surges followed by pullbacks," and prices have not yet rebounded to 50% of the previous decline (a key Fibonacci retracement level). Furthermore, momentum indicators suggest that upward momentum is gradually waning. Especially as gold prices approach the psychologically significant $5,000 mark, the bulls lack the drive for sustained upward movement and must remain highly cautious. It is also worth noting that this week's high for gold prices encountered resistance near the February lows, a level that has now become resistance after previously acting as significant support, further reinforcing the short-term downward pressure.
A potential double top pattern has formed near $5,000, indicating weakening upward momentum.
(COMEX Gold Daily Chart Source: FX678)
Observing the daily chart, gold prices have formed a potential double top pattern near the February low ($4,842) - this classic reversal pattern usually signifies the end of an uptrend, sounding an alarm for bulls; at the same time, the small bearish candlestick on Wednesday, with the price falling back just below the 50-day moving average, shows that short-term moving average support has turned into resistance, and the bulls' advance has been thwarted.
The indicators also send warning signals: the short-term RSI (2-period) shows a slight bearish divergence, meaning that the price has made a new high but the indicator has not risen in tandem, suggesting insufficient upward momentum; the 14-period RSI is also at risk of falling below the 50 midline, and once this position is breached, it will further confirm the weakening of the short-term upward trend.
Despite some technical uncertainties, and the possibility of gold prices continuing to rise slightly driven by capital inflows, the author believes that the top is near – most likely within the current price range, or after a slight upward test of the $5,000 psychological level and the high-volume level (HVN) at $5,048 before forming a top. The $5,048 level, as a high-volume level, represents a significant concentration of buying and selling activity; failure to break through it effectively will become a major resistance level limiting further upward movement in gold prices.
(COMEX Gold 4-hour chart source: EasyForex)
From the 4-hour chart, the potential double-top pattern coincides with the first resistance level (R1) on the weekly chart, further amplifying the short-term downside risk. Gold prices have now slightly retreated and are temporarily stabilizing in a dense area of multiple moving averages (5-day, 10-day, and 20-day). A slight rebound is possible in the short term, but given the overall lack of upward momentum, the rebound is expected to be limited and unlikely to change the short-term weak trend.
Key Trading Ideas
Based on technical chart patterns and key price levels, the following trading logic is provided for reference:
Short sellers tend to place short orders at Wednesday's high (around $4,842), with the key target at the weekly pivot point of $4,766. This level serves as a short-term dividing line between bullish and bearish sentiment; a break below it would open up further downside potential.
If gold prices break below $4,766, the next key levels to watch are the first weekly support level (S1) and the psychological level of $4,600. These levels have provided support multiple times during the previous rebound and are therefore of technical significance.
If the bulls unexpectedly gain momentum and break through the weekly resistance of $4,908 (R1), the short-term bearish view will be invalidated, and the gold price will once again challenge the $5,000 mark.
If gold prices reach $5,000, given the significant psychological resistance at this level and the pressure from previously trapped positions, it is highly likely to form a temporary high. At that time, opportunities for short sellers to re-enter the market may be worth watching.
Gold Futures Position Analysis (COT Report)
The positioning data further confirms the downward pressure on gold prices in the short term. According to the latest COT report released by the CFTC, large speculators' net long positions in gold have declined for the second consecutive week, while asset management institutions have reduced their net long positions for the third consecutive week. It is worth noting that although gold prices experienced a significant surge at the end of 2025, overall net long positions have already shown a continuous downward trend, reflecting a gradual weakening of institutional investors' confidence in the medium- to long-term upward trend of gold.
A more crucial signal is that since December 2025, asset management institutions have been gradually increasing their short positions, and last week large speculators also increased their short positions again. Although current data suggests that the increase in short positions is not enough to completely reverse the overall bullish market trend, this trend resonates with bearish signals from the technical indicators—gold is likely to be approaching a turning point, and subsequent market movements may favor a bearish stance. The continued accumulation of institutional short positions indicates that market divergence regarding future gold price increases is widening, and safe-haven demand has cooled, further weakening the upward momentum of gold prices.
- Risk Warning and Disclaimer
- The market involves risk, and trading may not be suitable for all investors. This article is for reference only and does not constitute personal investment advice, nor does it take into account certain users’ specific investment objectives, financial situation, or other needs. Any investment decisions made based on this information are at your own risk.