Gold Price Forecast: Can a Weaker Dollar Push Gold Prices Above the 50-Day Moving Average?
2026-04-16 19:39:34
On Thursday (April 16), spot gold rose slightly in early European trading, but remained within yesterday's trading range. This suggests that market traders are in a wait-and-see mode, with relatively light trading volume, and the market urgently needs a new catalyst to drive prices. Currently, the focus is on long-term US Treasury yields, the US dollar index, and the Federal Reserve's monetary policy direction. While geopolitical conflicts still exist, they are no longer the core factor dominating gold price fluctuations.

Technical Outlook
The current long-term trend for gold is mixed, with both bullish and bearish factors present. On March 23, gold prices successfully found support and stabilized at the 200-day moving average of $4099.12, validating the strong support level of this moving average. However, this stabilization occurred after the oscillator chart turned downwards. If we judge the short-term trend using the 50-day moving average at $4895.71, it remains in a downward pattern; however, since the low of $4099.12, gold prices have consistently formed a structure of higher highs and higher lows, indicating that the short-term trend has turned upwards, which is the main source of the current upward momentum in gold prices.
Despite the contradictory trends, I remain bullish, primarily because gold prices are trading above the long-term retracement support range of $4,744.34 to $4,541.88, which is a key support level. Short-term resistance lies in the retracement range of $4,850.68 to $5,028.04, with the 50-day moving average at $4,895.77 currently within this resistance zone.
For a strong upward trend to be established, spot gold needs to first establish a firm foothold above $4850.68 to form stronger support, and then break through the 50-day moving average resistance at $4895.76. If the bulls can strongly break through this key level, the price of gold is expected to rise further, targeting the short-term 61.8% Fibonacci retracement level of $5028.04.
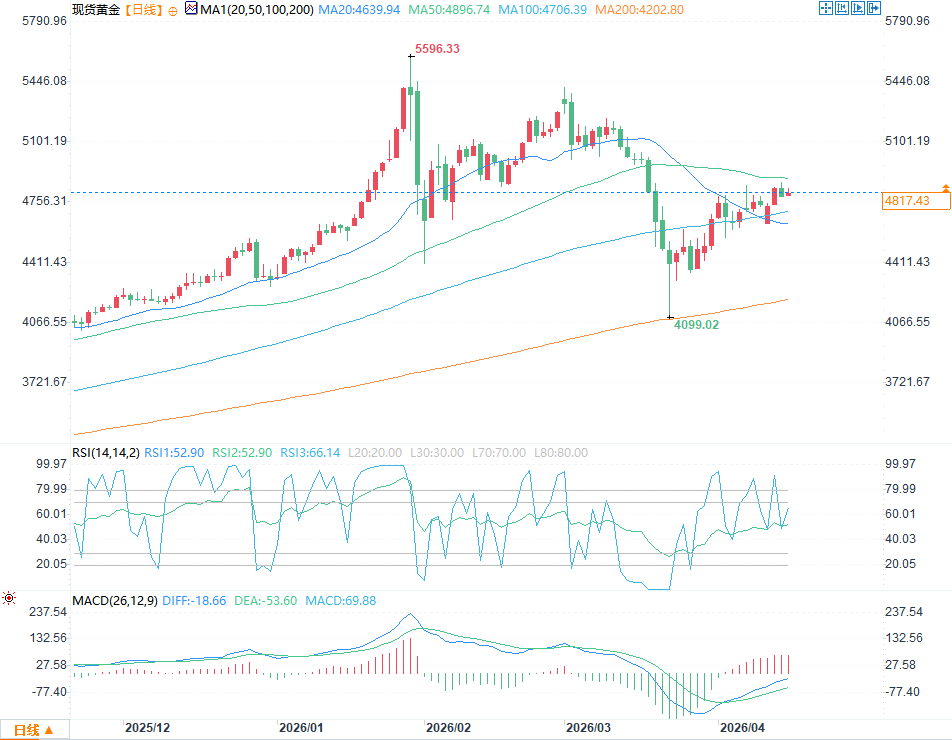
(Spot gold daily chart source: FX678)
These are the core conditions for a gold price rebound. Conversely, if the long-term support level of $4744.34 is breached and bears regain control of the market, gold prices will first test $4644.46, and then further test the long-term 61.8% Fibonacci retracement support level of $4541.88.
In short, the short-term trend of spot gold depends entirely on the market's reaction to the 50-day moving average at $4,895.84.
Yields and the US dollar are the core drivers of gold prices.
The yield on 10-year US Treasury bonds and the US dollar index have been declining since early April, creating the macroeconomic environment needed for gold to rise. The opportunity cost of holding non-yielding gold decreases as yields fall, while a weaker dollar makes it cheaper for overseas buyers to purchase gold; both factors are simultaneously beneficial to gold prices.
The decline in US Treasury yields was primarily driven by slowing market inflation expectations and growing investor confidence that the Federal Reserve will not need to maintain high interest rates for as long as previously anticipated. This shift in policy expectations directly boosted gold. Meanwhile, optimistic expectations of a potential agreement between the US and Iran further pressured yields and the US dollar index. The easing of geopolitical risk aversion and the shift in interest rate expectations combined to provide strong support for gold. As long as yields and the dollar continue to decline in tandem, gold prices will continue to receive favorable support.
At 19:06 Beijing time, spot gold was trading at $4,820.27 per ounce, up 0.62%.
Technical Outlook
The current long-term trend for gold is mixed, with both bullish and bearish factors present. On March 23, gold prices successfully found support and stabilized at the 200-day moving average of $4099.12, validating the strong support level of this moving average. However, this stabilization occurred after the oscillator chart turned downwards. If we judge the short-term trend using the 50-day moving average at $4895.71, it remains in a downward pattern; however, since the low of $4099.12, gold prices have consistently formed a structure of higher highs and higher lows, indicating that the short-term trend has turned upwards, which is the main source of the current upward momentum in gold prices.
Despite the contradictory trends, I remain bullish, primarily because gold prices are trading above the long-term retracement support range of $4,744.34 to $4,541.88, which is a key support level. Short-term resistance lies in the retracement range of $4,850.68 to $5,028.04, with the 50-day moving average at $4,895.77 currently within this resistance zone.
For a strong upward trend to be established, spot gold needs to first establish a firm foothold above $4850.68 to form stronger support, and then break through the 50-day moving average resistance at $4895.76. If the bulls can strongly break through this key level, the price of gold is expected to rise further, targeting the short-term 61.8% Fibonacci retracement level of $5028.04.
(Spot gold daily chart source: FX678)
These are the core conditions for a gold price rebound. Conversely, if the long-term support level of $4744.34 is breached and bears regain control of the market, gold prices will first test $4644.46, and then further test the long-term 61.8% Fibonacci retracement support level of $4541.88.
In short, the short-term trend of spot gold depends entirely on the market's reaction to the 50-day moving average at $4,895.84.
Yields and the US dollar are the core drivers of gold prices.
The yield on 10-year US Treasury bonds and the US dollar index have been declining since early April, creating the macroeconomic environment needed for gold to rise. The opportunity cost of holding non-yielding gold decreases as yields fall, while a weaker dollar makes it cheaper for overseas buyers to purchase gold; both factors are simultaneously beneficial to gold prices.
The decline in US Treasury yields was primarily driven by slowing market inflation expectations and growing investor confidence that the Federal Reserve will not need to maintain high interest rates for as long as previously anticipated. This shift in policy expectations directly boosted gold. Meanwhile, optimistic expectations of a potential agreement between the US and Iran further pressured yields and the US dollar index. The easing of geopolitical risk aversion and the shift in interest rate expectations combined to provide strong support for gold. As long as yields and the dollar continue to decline in tandem, gold prices will continue to receive favorable support.
At 19:06 Beijing time, spot gold was trading at $4,820.27 per ounce, up 0.62%.
- Risk Warning and Disclaimer
- The market involves risk, and trading may not be suitable for all investors. This article is for reference only and does not constitute personal investment advice, nor does it take into account certain users’ specific investment objectives, financial situation, or other needs. Any investment decisions made based on this information are at your own risk.