What's next for gold? $5044 is a key level to watch.
2026-04-21 18:15:00
On Tuesday (April 21), spot gold was quoted at around $4,787 per ounce during the European session, down 0.68%, erasing the 2% gain from the previous week. Last week's rise was mainly due to a temporary easing of tensions in the Strait of Hormuz region, which not only eased market concerns about rising inflation but also reignited investor expectations of a Federal Reserve rate cut. At the same time, a weaker dollar provided additional support for gold prices, with the dollar index falling 0.56% during the week, further boosting gold prices.

Despite some market recovery, gold prices are still about 9% lower than they were before the conflict broke out on February 27. This contrasts sharply with the S&P 500, which has fully recovered its losses and is up 3% from its previous level, highlighting gold's relative weakness during the recovery of risk sentiment.
However, bullish momentum indicators in the market have improved across the board: long positions in gold futures have rebounded significantly, inflows into exchange-traded funds (ETFs) have accelerated, and options traders have also significantly increased their bullish bets. Gold ETFs have seen net inflows for three consecutive weeks, with a net inflow of 21.7 tons in the week ending April 17, bringing the cumulative net inflow this year to 117.4 tons. However, the drag from capital outflows in March still exists, and this round of inflows has not yet been able to offset the net outflow of 89.6 tons last month.
Central Bank Gold Purchase Demand: March Data Shows Temporary Distortion
The structural trend of global central banks continuing to be net buyers of gold remains unchanged. Data from the World Gold Council in February showed that global central banks' monthly net gold purchases totaled 27 tons, roughly in line with the monthly average for 2025. However, the March central bank gold purchase data showed significant distortion, failing to reflect the true long-term demand trend.
Poland increased its holdings by 11 tons, China by 5 tons, and Uzbekistan by 9 tons, all three countries seizing the opportunity presented by the gold price correction to increase their holdings. However, according to data from various central banks, the Central Bank of Turkey significantly reduced its gold holdings by 118 tons that month, using direct sales and swap operations to raise funds to cope with soaring energy import costs and defend the lira's exchange rate. Turkish Central Bank Governor Callahan stated that the gold involved in the swap agreements will be repurchased upon maturity, meaning that this reduction was not a strategic abandonment of gold holdings by the central bank, but rather a short-term financing measure to address tight foreign exchange liquidity.
Short-term trends will be closely monitored in light of geopolitical developments.
The core driver of gold's short-term price movement remains the progress of US-Iran negotiations. The current ceasefire agreement expires Wednesday evening Eastern Time, and it is yet to be confirmed whether a second round of direct talks will take place. Further de-escalation of geopolitical tensions would benefit gold, a non-interest-bearing asset; conversely, if negotiations break down, the safe-haven premium will return, a factor that significantly pressured gold prices in March.
On Tuesday, Kevin Warsh's confirmation hearing for his nomination as Federal Reserve Chair in the Senate added further uncertainty to gold prices. Warsh has historically held a hawkish stance on the Fed's balance sheet contraction, raising market concerns about his ability to implement the interest rate cuts pushed by the Trump administration. A hawkish signal from Warsh would undermine the rate cut expectations supporting gold's rebound this week; a dovish stance, on the other hand, would raise questions about the Fed's independence.
In addition, inflation data from the UK and Japan to be released later this week will directly reflect the extent to which energy supply shocks are transmitted to overall consumer prices, and will further influence the pace of monetary easing by global central banks, indirectly affecting gold prices.
Technical Analysis
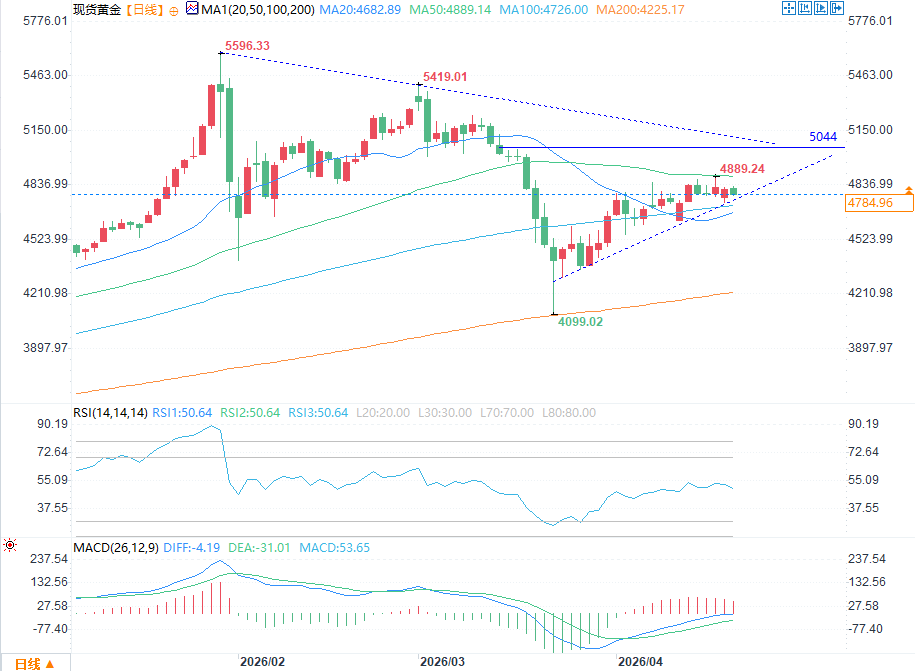
(Spot gold daily chart source: FX678)
The medium-term bullish trend for spot gold remains unchanged, with prices steadily trading above the 200-day moving average ($4225). After rebounding from a low of $4099, gold has recovered the 20-day moving average ($4683), but the upward momentum has temporarily stalled, with prices consolidating within a narrow range of $4683-$4889.
If gold prices can close strongly above the 50-day moving average ($4889), it will confirm a short-term breakout pattern, clearing the way for a retest of the previous resistance level above $5000. After breaking through this range, the main downtrend line connecting $5596 and the subsequent secondary high remains the core structural resistance for gold's medium-term upward movement. Only a decisive break above this trend line can officially signal the end of the gold price correction and open up space for a return to historical highs.
Despite some market recovery, gold prices are still about 9% lower than they were before the conflict broke out on February 27. This contrasts sharply with the S&P 500, which has fully recovered its losses and is up 3% from its previous level, highlighting gold's relative weakness during the recovery of risk sentiment.
However, bullish momentum indicators in the market have improved across the board: long positions in gold futures have rebounded significantly, inflows into exchange-traded funds (ETFs) have accelerated, and options traders have also significantly increased their bullish bets. Gold ETFs have seen net inflows for three consecutive weeks, with a net inflow of 21.7 tons in the week ending April 17, bringing the cumulative net inflow this year to 117.4 tons. However, the drag from capital outflows in March still exists, and this round of inflows has not yet been able to offset the net outflow of 89.6 tons last month.
Central Bank Gold Purchase Demand: March Data Shows Temporary Distortion
The structural trend of global central banks continuing to be net buyers of gold remains unchanged. Data from the World Gold Council in February showed that global central banks' monthly net gold purchases totaled 27 tons, roughly in line with the monthly average for 2025. However, the March central bank gold purchase data showed significant distortion, failing to reflect the true long-term demand trend.
Poland increased its holdings by 11 tons, China by 5 tons, and Uzbekistan by 9 tons, all three countries seizing the opportunity presented by the gold price correction to increase their holdings. However, according to data from various central banks, the Central Bank of Turkey significantly reduced its gold holdings by 118 tons that month, using direct sales and swap operations to raise funds to cope with soaring energy import costs and defend the lira's exchange rate. Turkish Central Bank Governor Callahan stated that the gold involved in the swap agreements will be repurchased upon maturity, meaning that this reduction was not a strategic abandonment of gold holdings by the central bank, but rather a short-term financing measure to address tight foreign exchange liquidity.
Short-term trends will be closely monitored in light of geopolitical developments.
The core driver of gold's short-term price movement remains the progress of US-Iran negotiations. The current ceasefire agreement expires Wednesday evening Eastern Time, and it is yet to be confirmed whether a second round of direct talks will take place. Further de-escalation of geopolitical tensions would benefit gold, a non-interest-bearing asset; conversely, if negotiations break down, the safe-haven premium will return, a factor that significantly pressured gold prices in March.
On Tuesday, Kevin Warsh's confirmation hearing for his nomination as Federal Reserve Chair in the Senate added further uncertainty to gold prices. Warsh has historically held a hawkish stance on the Fed's balance sheet contraction, raising market concerns about his ability to implement the interest rate cuts pushed by the Trump administration. A hawkish signal from Warsh would undermine the rate cut expectations supporting gold's rebound this week; a dovish stance, on the other hand, would raise questions about the Fed's independence.
In addition, inflation data from the UK and Japan to be released later this week will directly reflect the extent to which energy supply shocks are transmitted to overall consumer prices, and will further influence the pace of monetary easing by global central banks, indirectly affecting gold prices.
Technical Analysis
(Spot gold daily chart source: FX678)
The medium-term bullish trend for spot gold remains unchanged, with prices steadily trading above the 200-day moving average ($4225). After rebounding from a low of $4099, gold has recovered the 20-day moving average ($4683), but the upward momentum has temporarily stalled, with prices consolidating within a narrow range of $4683-$4889.
If gold prices can close strongly above the 50-day moving average ($4889), it will confirm a short-term breakout pattern, clearing the way for a retest of the previous resistance level above $5000. After breaking through this range, the main downtrend line connecting $5596 and the subsequent secondary high remains the core structural resistance for gold's medium-term upward movement. Only a decisive break above this trend line can officially signal the end of the gold price correction and open up space for a return to historical highs.
- Risk Warning and Disclaimer
- The market involves risk, and trading may not be suitable for all investors. This article is for reference only and does not constitute personal investment advice, nor does it take into account certain users’ specific investment objectives, financial situation, or other needs. Any investment decisions made based on this information are at your own risk.