The situation in Iran is only one real signal remaining, but the US dollar and US Treasury bonds are giving two contradictory answers.
2026-04-22 20:42:42
On Wednesday (April 22), global financial markets entered a relatively delicate period of equilibrium. After experiencing sharp fluctuations triggered by geopolitical volatility, the market is attempting to find a new pricing anchor amidst uncertainty. With the Federal Reserve officially entering its blackout period ahead of its April 28-29 policy meeting, and no major economic data releases scheduled for today, investors' focus has shifted from monetary policy expectations to the Treasury's financing pace and marginal changes in the geopolitical situation.
Currently, US Treasury yields , the US dollar index , and spot gold are exhibiting a constrained, oscillating pattern. On the one hand, trade uncertainty stemming from tariff rhetoric and discussions about AI-driven productivity have kept long-term inflation expectations in a state of flux. On the other hand, while the extension of the ceasefire regarding the international situation has reduced immediate "tail risk," it has not completely eliminated premiums. This "managed tension" has led to a repeated tug-of-war between the safe-haven appeal and holding costs for gold and US Treasury bonds.
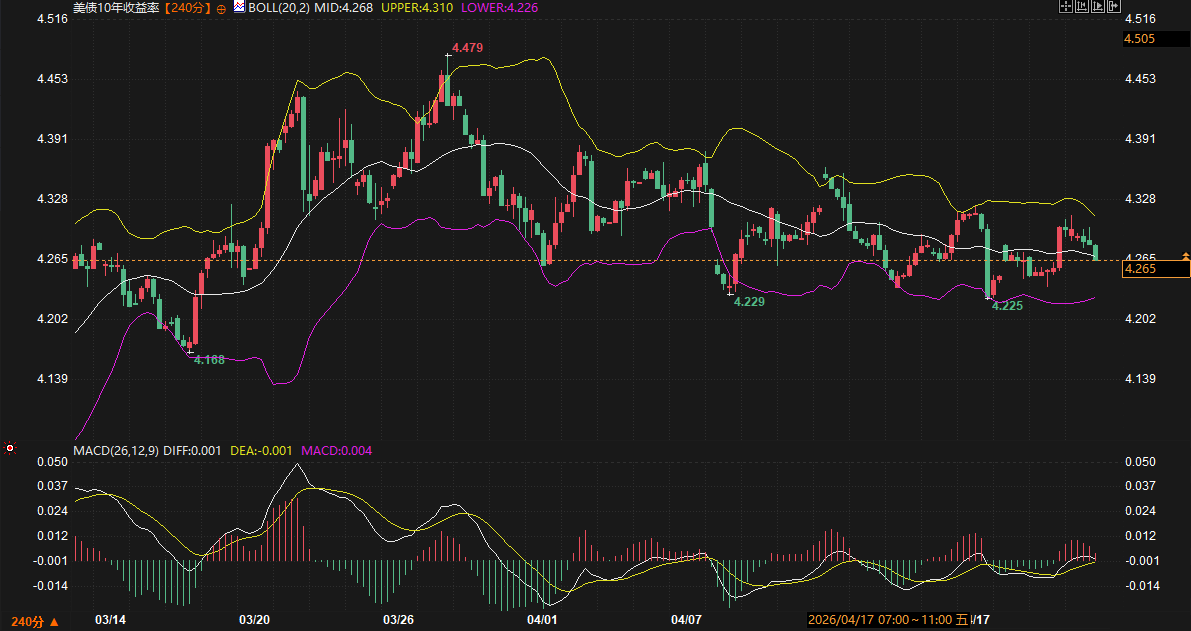
From a 4-hour chart perspective, the 10-year US Treasury yield is currently trading around 4.265%. Technically, the Bollinger Bands are showing clear signs of narrowing, with the middle band at 4.268%, indicating that the market is at the end of a volatility convergence phase. Although the MACD indicator has formed a golden cross near the zero line, the expansion of the red momentum bars is extremely limited, reflecting a lack of upward momentum.
Fundamentally, market liquidity today was primarily driven by Treasury issuance activities. $69 billion in 17-week short-term Treasury notes were issued, along with $13 billion in reissued 20-year Treasury notes. Based on recent analyses from prominent institutions, investor demand for long-term bonds will directly determine whether yields can effectively break through resistance levels. Currently, support is mainly concentrated between 4.225% and 4.226% (lower Bollinger Band and mid-April low), while resistance lies at the upper Bollinger Band at 4.310%.
Given the recent conflict between discussions among Federal Reserve officials regarding the potential for artificial intelligence to curb inflation and market skepticism, yields lack fundamental support to break through the previous high of 4.479% in the short term. In the next 2-3 trading days, US Treasury yields are more likely to remain range-bound between 4.26% and 4.30%, awaiting further guidance from next week's interest rate meeting.
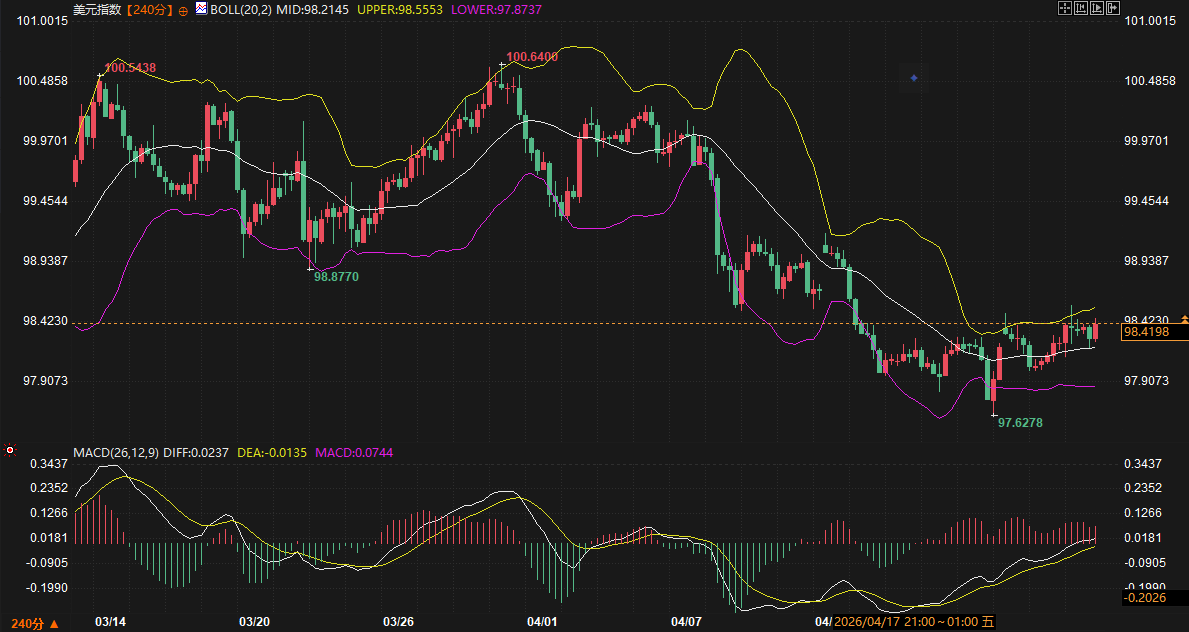
After its decline in mid-April, the US dollar index has shown strong resilience and is currently trading around 98.42. On the 4-hour chart, the price has successfully broken above the Bollinger Band middle line (98.21) and is attempting to break through the upper band at 98.55. The continued expansion of the MACD red histogram indicates that the short-term technical rebound momentum has not yet weakened.
However, further appreciation of the US dollar faces the offsetting effect of declining geopolitical premiums. While the indefinite extension of the ceasefire agreement in the relevant regions has disrupted inflation expectations due to the sharp fluctuations in oil prices, it has also weakened the absolute appeal of the US dollar as a single safe-haven asset. Furthermore, the debate surrounding "tariff rhetoric" has not yet entered a substantive stage, and the market is largely in a wait-and-see period.
In the short term, the US dollar index is facing resistance between 98.55 and 98.90. If it fails to break through the upper resistance level with significant volume, profit-taking may occur. Support is seen between 98.21 and 97.87. The dollar is expected to maintain a slightly bullish trend over the next two days, but the rate of increase will slow.
The current price movement of spot gold is closely linked to the "entity uncertainty" of geopolitics. Although the ceasefire agreement removed the trigger for immediate conflict, the continued existence of the naval blockade still provides a floor support for gold prices.
From the perspective of related assets, the rebound of the US dollar has put some pricing pressure on gold, while the sideways movement of US Treasury yields has slowed the rise in the cost of holding gold. This offsetting force has resulted in gold prices recently entering a typical trading range. Technically, gold prices are facing significant selling pressure near previous highs, especially given the market sentiment shifting towards "selling on rallies."
Over the next 2-3 days, gold's price movement will heavily depend on whether new geopolitical tensions ignite. In the absence of significant data releases, support levels for gold will likely be based on previous lows and technical support levels, while resistance will be limited by the strong rebound of the US dollar. Overall, gold lacks a catalyst for a sustained upward move in the short term and is more likely to consolidate within a range before making a directional move.
In summary, the global market will be in a period of intertwined "data vacuum" and "sentiment recovery" over the next 2-3 trading days. US Treasury yields, lacking new variables in monetary policy, will likely remain within a narrow range of 4.22%-4.31%. The US dollar index, benefiting from technical recovery, has the potential to challenge resistance above 98.55, but caution is advised regarding a potential reverse correction due to easing geopolitical tensions.
For spot gold, the pressure of profit-taking after the short-term positive factors have been fully priced in should not be ignored. Ahead of the Federal Reserve meeting, market participants generally prefer to hold cash or engage in range trading rather than establishing large-scale one-sided positions. Investors should closely monitor subtle developments in geopolitical tensions and the auction multiple of US Treasury bonds, as these will be key factors in breaking the current sideways stalemate.
1. Why did gold and oil prices not plummet despite the easing of geopolitical tensions?
While the current ceasefire agreement removes the immediate threat of war, as prominent institutions have pointed out, it merely shifts from a “binary confrontation” to “protracted administrative tension.” The blockade remains, and the potential risk of retaliation has not been eliminated. This ongoing uncertainty provides a “risk premium floor” for commodities, resulting in relatively resilient prices during pullbacks.
2. What specific impact has the Fed's blackout period had on the market in recent days?
The blackout period means the market loses a significant source of momentum from official statements. Without official "leaks," the market will revert to technical drivers and become more sensitive to existing Treasury bond issuance plans. This implies that, unless there are unexpected geopolitical events, market volatility in the next two days will typically be lower than outside the blackout period.
3. How does the discussion of artificial intelligence (AI) affect the logic of US Treasury yields?
This involves long-term inflation expectations. If AI can indeed significantly improve productivity, it could theoretically reduce production costs, thereby suppressing inflation. If the market accepts this logic, the long-term peak of US Treasury yields would shift downwards. However, as some senators have pointed out, the market remains skeptical of this "AI dividend," and this divergence has caused US Treasury yields to fluctuate at high levels, making it difficult to form a unified force for a breakthrough.
4. Why is the resistance level around 98.55 for the US dollar index so crucial?
98.55 is currently the upper Bollinger Band on the 4-hour chart and a key technical level for the previous pullback. Since the MACD indicator is already at a relatively high level, if it encounters resistance and falls back here, it will form a short-term "double top" pattern; conversely, if it can hold above this level, it signifies the establishment of a medium-term reversal trend for the US dollar.
5. What signal does today's issuance of treasury bonds by the Ministry of Finance send to ordinary investors?
Treasury bond issuance serves as a "health check" for market demand for dollar assets. If the issuance rate is lower than market expectations and the subscription multiple is high, it indicates that safe-haven funds still crave US Treasuries, which will suppress yields and support the dollar; conversely, it may trigger selling pressure. During periods of data inactivity, this is the only practical trading indicator.
Currently, US Treasury yields , the US dollar index , and spot gold are exhibiting a constrained, oscillating pattern. On the one hand, trade uncertainty stemming from tariff rhetoric and discussions about AI-driven productivity have kept long-term inflation expectations in a state of flux. On the other hand, while the extension of the ceasefire regarding the international situation has reduced immediate "tail risk," it has not completely eliminated premiums. This "managed tension" has led to a repeated tug-of-war between the safe-haven appeal and holding costs for gold and US Treasury bonds.
US Treasury Yields: Supply and Demand Game in Narrow Range Trading
From a 4-hour chart perspective, the 10-year US Treasury yield is currently trading around 4.265%. Technically, the Bollinger Bands are showing clear signs of narrowing, with the middle band at 4.268%, indicating that the market is at the end of a volatility convergence phase. Although the MACD indicator has formed a golden cross near the zero line, the expansion of the red momentum bars is extremely limited, reflecting a lack of upward momentum.
Fundamentally, market liquidity today was primarily driven by Treasury issuance activities. $69 billion in 17-week short-term Treasury notes were issued, along with $13 billion in reissued 20-year Treasury notes. Based on recent analyses from prominent institutions, investor demand for long-term bonds will directly determine whether yields can effectively break through resistance levels. Currently, support is mainly concentrated between 4.225% and 4.226% (lower Bollinger Band and mid-April low), while resistance lies at the upper Bollinger Band at 4.310%.
Given the recent conflict between discussions among Federal Reserve officials regarding the potential for artificial intelligence to curb inflation and market skepticism, yields lack fundamental support to break through the previous high of 4.479% in the short term. In the next 2-3 trading days, US Treasury yields are more likely to remain range-bound between 4.26% and 4.30%, awaiting further guidance from next week's interest rate meeting.
US Dollar Index: Technical Pressure After Rebound from Bottom
After its decline in mid-April, the US dollar index has shown strong resilience and is currently trading around 98.42. On the 4-hour chart, the price has successfully broken above the Bollinger Band middle line (98.21) and is attempting to break through the upper band at 98.55. The continued expansion of the MACD red histogram indicates that the short-term technical rebound momentum has not yet weakened.
However, further appreciation of the US dollar faces the offsetting effect of declining geopolitical premiums. While the indefinite extension of the ceasefire agreement in the relevant regions has disrupted inflation expectations due to the sharp fluctuations in oil prices, it has also weakened the absolute appeal of the US dollar as a single safe-haven asset. Furthermore, the debate surrounding "tariff rhetoric" has not yet entered a substantive stage, and the market is largely in a wait-and-see period.
In the short term, the US dollar index is facing resistance between 98.55 and 98.90. If it fails to break through the upper resistance level with significant volume, profit-taking may occur. Support is seen between 98.21 and 97.87. The dollar is expected to maintain a slightly bullish trend over the next two days, but the rate of increase will slow.
Spot gold: A tug-of-war between fading safe-haven demand and cost factors
The current price movement of spot gold is closely linked to the "entity uncertainty" of geopolitics. Although the ceasefire agreement removed the trigger for immediate conflict, the continued existence of the naval blockade still provides a floor support for gold prices.
From the perspective of related assets, the rebound of the US dollar has put some pricing pressure on gold, while the sideways movement of US Treasury yields has slowed the rise in the cost of holding gold. This offsetting force has resulted in gold prices recently entering a typical trading range. Technically, gold prices are facing significant selling pressure near previous highs, especially given the market sentiment shifting towards "selling on rallies."
Over the next 2-3 days, gold's price movement will heavily depend on whether new geopolitical tensions ignite. In the absence of significant data releases, support levels for gold will likely be based on previous lows and technical support levels, while resistance will be limited by the strong rebound of the US dollar. Overall, gold lacks a catalyst for a sustained upward move in the short term and is more likely to consolidate within a range before making a directional move.
Future Outlook
In summary, the global market will be in a period of intertwined "data vacuum" and "sentiment recovery" over the next 2-3 trading days. US Treasury yields, lacking new variables in monetary policy, will likely remain within a narrow range of 4.22%-4.31%. The US dollar index, benefiting from technical recovery, has the potential to challenge resistance above 98.55, but caution is advised regarding a potential reverse correction due to easing geopolitical tensions.
For spot gold, the pressure of profit-taking after the short-term positive factors have been fully priced in should not be ignored. Ahead of the Federal Reserve meeting, market participants generally prefer to hold cash or engage in range trading rather than establishing large-scale one-sided positions. Investors should closely monitor subtle developments in geopolitical tensions and the auction multiple of US Treasury bonds, as these will be key factors in breaking the current sideways stalemate.
Frequently Asked Questions
1. Why did gold and oil prices not plummet despite the easing of geopolitical tensions?
While the current ceasefire agreement removes the immediate threat of war, as prominent institutions have pointed out, it merely shifts from a “binary confrontation” to “protracted administrative tension.” The blockade remains, and the potential risk of retaliation has not been eliminated. This ongoing uncertainty provides a “risk premium floor” for commodities, resulting in relatively resilient prices during pullbacks.
2. What specific impact has the Fed's blackout period had on the market in recent days?
The blackout period means the market loses a significant source of momentum from official statements. Without official "leaks," the market will revert to technical drivers and become more sensitive to existing Treasury bond issuance plans. This implies that, unless there are unexpected geopolitical events, market volatility in the next two days will typically be lower than outside the blackout period.
3. How does the discussion of artificial intelligence (AI) affect the logic of US Treasury yields?
This involves long-term inflation expectations. If AI can indeed significantly improve productivity, it could theoretically reduce production costs, thereby suppressing inflation. If the market accepts this logic, the long-term peak of US Treasury yields would shift downwards. However, as some senators have pointed out, the market remains skeptical of this "AI dividend," and this divergence has caused US Treasury yields to fluctuate at high levels, making it difficult to form a unified force for a breakthrough.
4. Why is the resistance level around 98.55 for the US dollar index so crucial?
98.55 is currently the upper Bollinger Band on the 4-hour chart and a key technical level for the previous pullback. Since the MACD indicator is already at a relatively high level, if it encounters resistance and falls back here, it will form a short-term "double top" pattern; conversely, if it can hold above this level, it signifies the establishment of a medium-term reversal trend for the US dollar.
5. What signal does today's issuance of treasury bonds by the Ministry of Finance send to ordinary investors?
Treasury bond issuance serves as a "health check" for market demand for dollar assets. If the issuance rate is lower than market expectations and the subscription multiple is high, it indicates that safe-haven funds still crave US Treasuries, which will suppress yields and support the dollar; conversely, it may trigger selling pressure. During periods of data inactivity, this is the only practical trading indicator.
- Risk Warning and Disclaimer
- The market involves risk, and trading may not be suitable for all investors. This article is for reference only and does not constitute personal investment advice, nor does it take into account certain users’ specific investment objectives, financial situation, or other needs. Any investment decisions made based on this information are at your own risk.