Did the authorities' efforts amount to nothing? The yen surged but quickly deflated, with technical indicators showing a major top signal! The AUD/JPY pair was the only exception.
2026-05-06 12:19:19
The yen weakened again after a brief surge, suspected to be influenced by intervention from Japan's Ministry of Finance and the Bank of Japan. The USD/JPY pair rebounded sharply this week but encountered resistance near a key level; the EUR/JPY and AUD/JPY pairs, however, showed different signals and diverged in their trends.
The intervention is reportedly over three trading days in the past. While not officially confirmed, Nikkei reported the intervention just hours after it occurred. At that time, the yen surged, causing the USD/JPY exchange rate to fall by more than 500 basis points throughout the day, and traders were generally wary of another round of intervention.
Historical data shows that the vast majority of volatility occurs on the day of intervention, and volatility typically decreases and the market tends to consolidate over the following week or so. So far, this assessment has been largely confirmed by the decrease in volatility. However, the difference is that the yen has weakened over the past three trading days, and with Thursday's pullback, the downward momentum has strengthened in the past 24 hours.
The core issue currently on the market's mind is whether USD/JPY will experience another round of decline. From a technical perspective, conditions for a bearish trend are accumulating. Historical experience shows that intervention often coincides with significant tops in USD/JPY, after which a bearish trend typically lasts for weeks or even months.
The forward yield chart shows that from the day of intervention (T+0) to six days later (T+6), the volatility of yen currency pairs generally tended to decline. The daily volatility of USD/JPY narrowed significantly; while the volatility of AUD/JPY, EUR/JPY, and GBP/JPY was not entirely consistent, it also showed an overall downward trend.
However, the daily returns of USD/JPY and other yen crosses largely lack consistency. The only exception is GBP/JPY, which exhibits decreasing negative returns from T+1 to T+3, followed by a rebound in T+4 and T+5.
The daily chart shows that USD/JPY has risen to a four-day high after forming two bullish hammer candlesticks near Thursday's lows. Momentum strengthened on Tuesday amid moderate risk appetite – Wall Street hit new highs while crude oil and the yen weakened, with the yen being the weakest performer among major currencies.
USD/JPY has broken slightly above its weekly and monthly pivot points, but encountered resistance before reaching the 158 level. The 50-day exponential moving average (158.27) is nearby, posing potential resistance, and the market is looking for signals of swing highs to indicate the next round of declines.
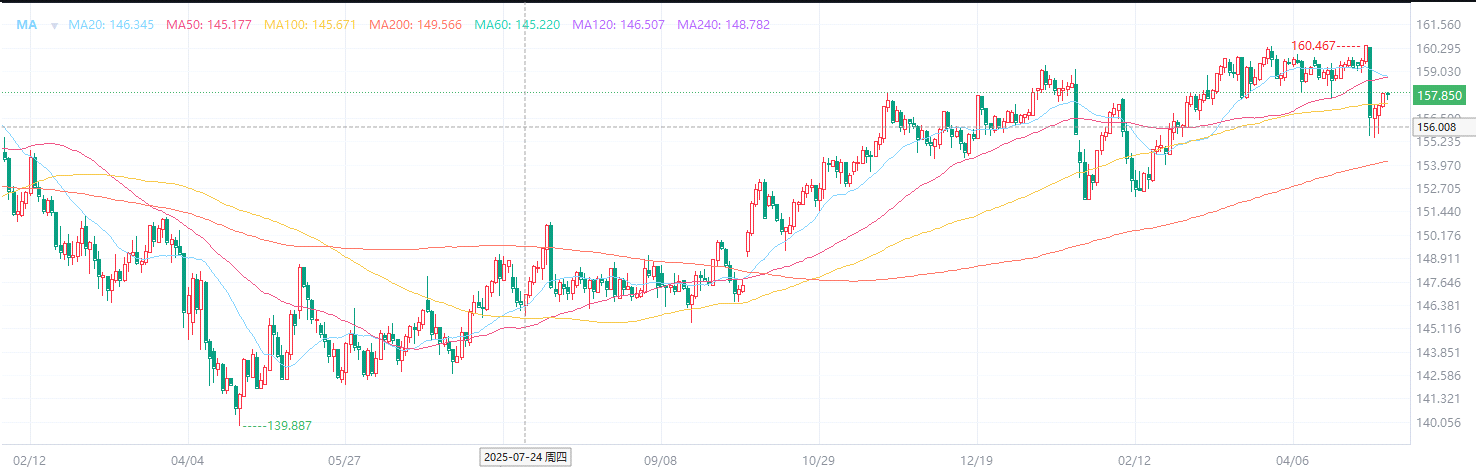
(USD/JPY daily chart, source: FX678)
The 4-hour chart shows that the 50% retracement level of last week's decline is slightly above 158, making it a key level to observe potential swing highs. If prices move further up, resistance levels are distributed between 158.71 (61.8% retracement) and 158.95 (previous swing low), slightly below the 159 level.
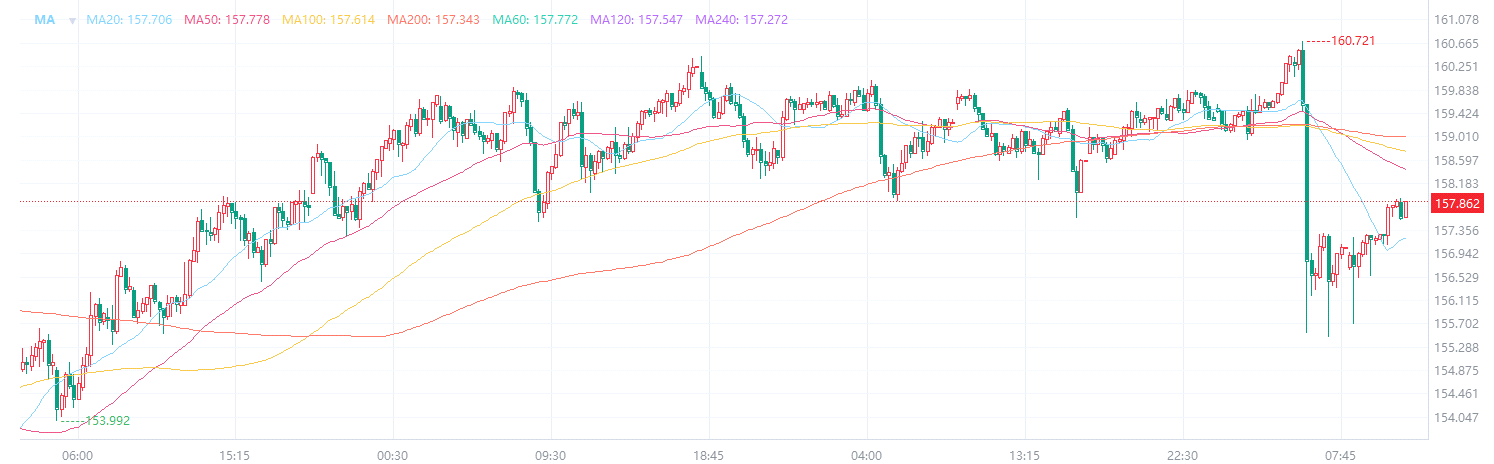
(USD/JPY 4-hour chart, source: FX678)
If the bears regain control, a daily closing price below 156.44 would be technically significant. A break below the cycle low of 155.49 would open the way for further declines towards the 155 level, below which lie the 200-day exponential moving average (154.98) and the 200-day simple moving average (154.15). The weekly and monthly S1 pivot points lie between these two moving averages, making the 154-155 area a potentially strong support zone if touched.
While EUR/JPY exhibits a similar pattern to USD/JPY, euro bulls have been relatively weak against the yen. The price is also approaching a dense resistance zone, located between the monthly pivot point (184.65) and the 50-day exponential moving average/high-volume level (around 184.90), slightly below the 185 mark.
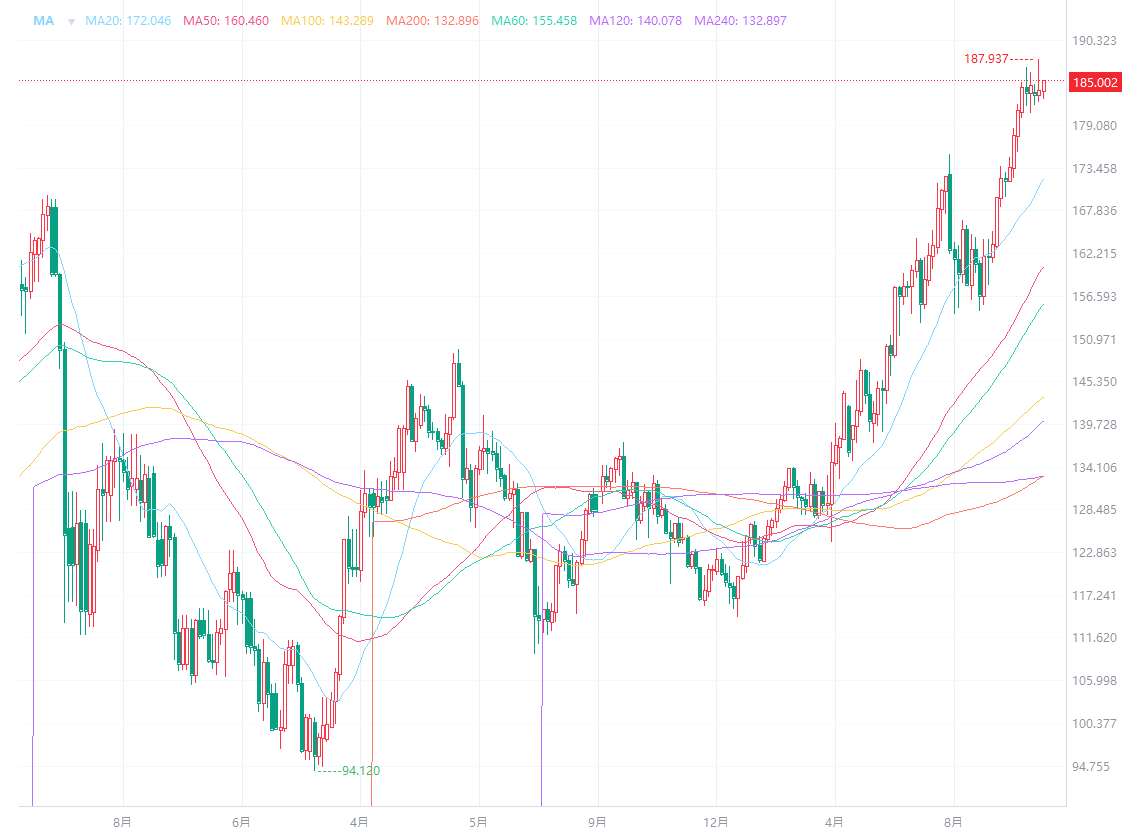
(EUR/JPY monthly chart, source: FX678)
When identifying potential swing highs, it's advisable to allow for some margin of error and not treat these areas as price levels that must be precisely retraced. However, when such a cluster of resistance forms, a false breakout above 185 followed by a pullback below that level would be a strong signal that a swing high may have already formed.
If bearish momentum returns, the area near the November high (182), as well as the S1 pivot point and the swing low at 181.12, are all potential downside targets.
The Australian dollar/Japanese yen pair is an exception among these three currency pairs, and the only one trading above both 50-day moving averages. Intraday momentum also strengthened during the US trading session. Despite the Reserve Bank of Australia's hawkish rate hike—slightly less aggressive than some market expectations—the Australian dollar/Japanese yen pair remains relatively less attractive to short sellers than the euro/Japanese yen and the US dollar/Japanese yen pair.
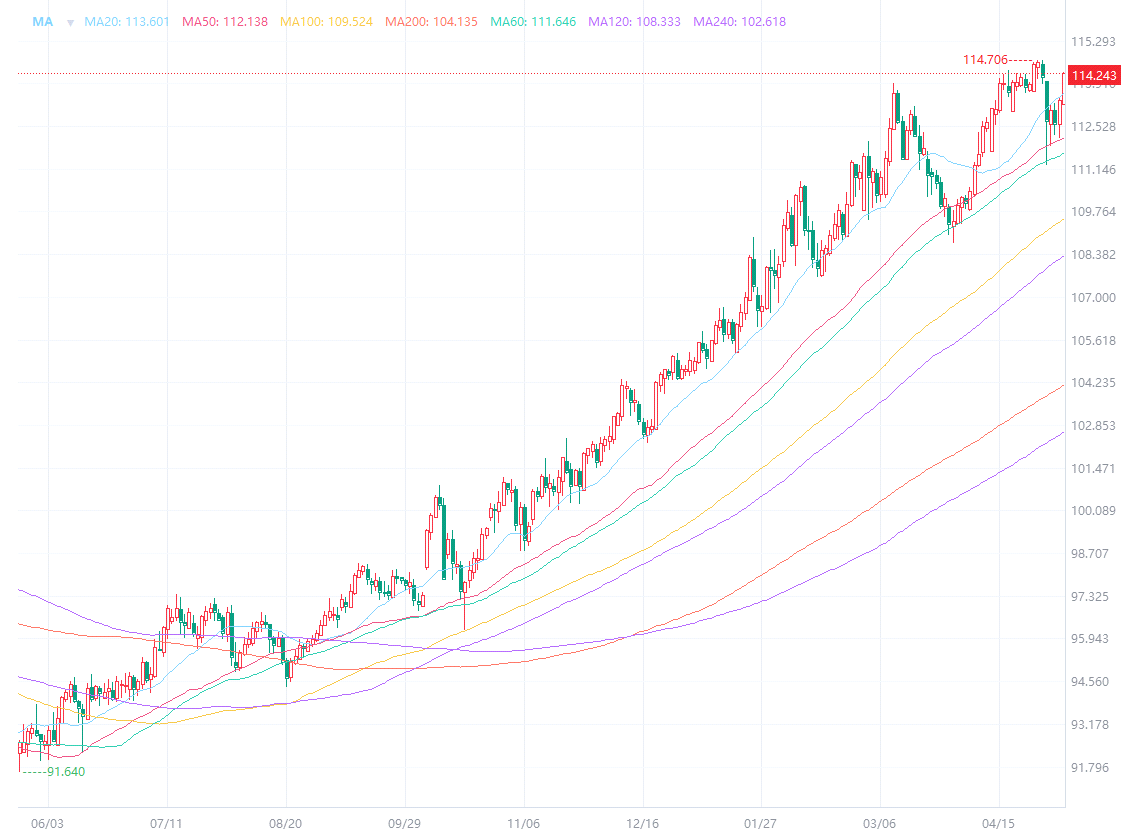
(AUD/JPY daily chart, source: FX678)
That said, further intervention by the Japanese Ministry of Finance/Bank of Japan would also put pressure on the AUD/JPY pair. However, if the yen continues to weaken, the AUD/JPY pair would be a more attractive long position due to its strong performance during the recent yen appreciation.
A move towards 114.30 is feasible, but a conservative approach to the upside target is advisable at present. Bulls should adopt a cautious strategy, allowing room for a potential reversal – the AUD/JPY pair could also form a swing high should the yen regain its upward momentum.
In summary, the short-term impact of the intervention has clearly subsided, and market volatility is gradually returning to normal. The technical indicators for USD/JPY and EUR/JPY are gradually building a bearish foundation, while AUD/JPY remains relatively strong, exhibiting a clear divergence.
USD/JPY and EUR/JPY: Focus on the formation of swing highs. If the resistance level is confirmed to be effective, consider a shorting strategy on rallies.
AUD/JPY: Although the upside target is around 114.30, caution is advised to allow for a potential reversal if the yen strengthens again. It is not advisable to chase the price higher.
The future movements of each currency pair will depend heavily on whether the Japanese authorities intervene again and the evolution of market risk appetite.
At 12:18 Beijing time, the USD/JPY exchange rate is currently at 157.82/83.
The intervention is reportedly over three trading days in the past. While not officially confirmed, Nikkei reported the intervention just hours after it occurred. At that time, the yen surged, causing the USD/JPY exchange rate to fall by more than 500 basis points throughout the day, and traders were generally wary of another round of intervention.
Historical data shows that the vast majority of volatility occurs on the day of intervention, and volatility typically decreases and the market tends to consolidate over the following week or so. So far, this assessment has been largely confirmed by the decrease in volatility. However, the difference is that the yen has weakened over the past three trading days, and with Thursday's pullback, the downward momentum has strengthened in the past 24 hours.
The core issue currently on the market's mind is whether USD/JPY will experience another round of decline. From a technical perspective, conditions for a bearish trend are accumulating. Historical experience shows that intervention often coincides with significant tops in USD/JPY, after which a bearish trend typically lasts for weeks or even months.
I. Volatility eases after intervention, but returns remain inconsistent.
The forward yield chart shows that from the day of intervention (T+0) to six days later (T+6), the volatility of yen currency pairs generally tended to decline. The daily volatility of USD/JPY narrowed significantly; while the volatility of AUD/JPY, EUR/JPY, and GBP/JPY was not entirely consistent, it also showed an overall downward trend.
However, the daily returns of USD/JPY and other yen crosses largely lack consistency. The only exception is GBP/JPY, which exhibits decreasing negative returns from T+1 to T+3, followed by a rebound in T+4 and T+5.
II. USD/JPY: Rebound encounters resistance; watch for swing high signals.
The daily chart shows that USD/JPY has risen to a four-day high after forming two bullish hammer candlesticks near Thursday's lows. Momentum strengthened on Tuesday amid moderate risk appetite – Wall Street hit new highs while crude oil and the yen weakened, with the yen being the weakest performer among major currencies.
USD/JPY has broken slightly above its weekly and monthly pivot points, but encountered resistance before reaching the 158 level. The 50-day exponential moving average (158.27) is nearby, posing potential resistance, and the market is looking for signals of swing highs to indicate the next round of declines.
(USD/JPY daily chart, source: FX678)
The 4-hour chart shows that the 50% retracement level of last week's decline is slightly above 158, making it a key level to observe potential swing highs. If prices move further up, resistance levels are distributed between 158.71 (61.8% retracement) and 158.95 (previous swing low), slightly below the 159 level.
(USD/JPY 4-hour chart, source: FX678)
If the bears regain control, a daily closing price below 156.44 would be technically significant. A break below the cycle low of 155.49 would open the way for further declines towards the 155 level, below which lie the 200-day exponential moving average (154.98) and the 200-day simple moving average (154.15). The weekly and monthly S1 pivot points lie between these two moving averages, making the 154-155 area a potentially strong support zone if touched.
3. EUR/JPY: Similar pattern, but lacking bullish momentum.
While EUR/JPY exhibits a similar pattern to USD/JPY, euro bulls have been relatively weak against the yen. The price is also approaching a dense resistance zone, located between the monthly pivot point (184.65) and the 50-day exponential moving average/high-volume level (around 184.90), slightly below the 185 mark.
(EUR/JPY monthly chart, source: FX678)
When identifying potential swing highs, it's advisable to allow for some margin of error and not treat these areas as price levels that must be precisely retraced. However, when such a cluster of resistance forms, a false breakout above 185 followed by a pullback below that level would be a strong signal that a swing high may have already formed.
If bearish momentum returns, the area near the November high (182), as well as the S1 pivot point and the swing low at 181.12, are all potential downside targets.
IV. AUD/JPY: Independent and Relatively Strong
The Australian dollar/Japanese yen pair is an exception among these three currency pairs, and the only one trading above both 50-day moving averages. Intraday momentum also strengthened during the US trading session. Despite the Reserve Bank of Australia's hawkish rate hike—slightly less aggressive than some market expectations—the Australian dollar/Japanese yen pair remains relatively less attractive to short sellers than the euro/Japanese yen and the US dollar/Japanese yen pair.
(AUD/JPY daily chart, source: FX678)
That said, further intervention by the Japanese Ministry of Finance/Bank of Japan would also put pressure on the AUD/JPY pair. However, if the yen continues to weaken, the AUD/JPY pair would be a more attractive long position due to its strong performance during the recent yen appreciation.
A move towards 114.30 is feasible, but a conservative approach to the upside target is advisable at present. Bulls should adopt a cautious strategy, allowing room for a potential reversal – the AUD/JPY pair could also form a swing high should the yen regain its upward momentum.
Trends diverge, and corresponding strategies vary.
In summary, the short-term impact of the intervention has clearly subsided, and market volatility is gradually returning to normal. The technical indicators for USD/JPY and EUR/JPY are gradually building a bearish foundation, while AUD/JPY remains relatively strong, exhibiting a clear divergence.
USD/JPY and EUR/JPY: Focus on the formation of swing highs. If the resistance level is confirmed to be effective, consider a shorting strategy on rallies.
AUD/JPY: Although the upside target is around 114.30, caution is advised to allow for a potential reversal if the yen strengthens again. It is not advisable to chase the price higher.
The future movements of each currency pair will depend heavily on whether the Japanese authorities intervene again and the evolution of market risk appetite.
At 12:18 Beijing time, the USD/JPY exchange rate is currently at 157.82/83.
- Risk Warning and Disclaimer
- The market involves risk, and trading may not be suitable for all investors. This article is for reference only and does not constitute personal investment advice, nor does it take into account certain users’ specific investment objectives, financial situation, or other needs. Any investment decisions made based on this information are at your own risk.