Risk sentiment dominates the direction of the New Zealand dollar, while bets on interest rate hikes become secondary.
2026-05-06 13:31:30
While New Zealand's Q1 labor market report may have weakened the case for the Reserve Bank of New Zealand's recent aggressive tightening, this is unlikely to be the primary driver of the current New Zealand dollar's performance. Broader risk appetite fluctuations related to the conflict with Iran and oil price movements continue to dominate price action in the foreign exchange market, relegating local interest rate expectations to a secondary consideration for traders.
New Zealand's first-quarter labor market data differed from market expectations. The unemployment rate unexpectedly fell to 5.3%, but the underlying details were weak. The quarterly employment growth rate was only 0.2%, lower than expected; the labor force participation rate slightly decreased from 70.5% to 70.4%, indicating that the decline in the unemployment rate was partly due to a decrease in the labor force rather than a significant increase in jobs.
Wage growth was slightly stronger than expected, with private sector labor costs rising 0.5% in the quarter, higher than the market expectation of 0.4%. However, the annual wage growth rate remained at 2%, indicating that underlying wage pressures remain moderate.
The data was mixed, mirroring the Reserve Bank of New Zealand's (RBNZ) first-quarter labor market forecast. Employment growth fell short of the bank's 0.4% forecast, with the actual employment rate at 66.7%, slightly below the expected 66.8%. The unemployment rate met the RBNZ's forecast of 5.3%, while labor costs rose slightly more than the expected 0.4%.
Broader measures continue to point to ample slack in the labor market. The underemployment rate remains high at 12.9%, while the youth NEET rate, which measures the proportion of people aged 15-24 who are not employed, in education, or in training, climbed from 13.3% to 14.4%.
While the labor market downturn may be bottoming out, the recovery remains weak and fragile. This macroeconomic backdrop makes it difficult to compel the Reserve Bank of New Zealand to hastily raise interest rates due to rising energy prices triggered by the situation in Iran.
Following the report's release, the market perceived a 38% probability of the Reserve Bank of New Zealand (RBNZ) raising interest rates later this month. However, given the signals the report conveyed, this expectation appears somewhat aggressive. While the RBNZ's sole mandate is to keep inflation low and stable, it remains questionable whether these energy shocks will generate a significant second wave of inflation, given the current weak demand and apparent labor market slack, unless high energy prices triggered by the Iranian conflict persist for several quarters.
The next key piece of information will be the Reserve Bank of New Zealand's (RBNZ) forecasts survey, released on May 13th, which will update professional forecasters' views on the inflation outlook for the next two years . In February, the two-year inflation expectation was 2.37%, further deviating from the midpoint of the bank's 1%-3% inflation target range. It can be inferred that only a significant acceleration in inflation expectations back to near the upper end of this range will trigger market concerns about an immediate rate hike by the RBNZ in two weeks.
Since the May meeting, the market has fully priced in a July rate hike, with a 90% probability of a second hike in September. The specific trajectory will largely depend on the duration of the Iranian conflict. However, given that the Reserve Bank of New Zealand considers the neutral level for the cash rate to be around 3%, this rate hike path currently appears somewhat aggressive.
While currency markets are still closely watching changes in local data, the New Zealand dollar is not. Currently, the New Zealand dollar's movements are more driven by broader risk appetite than by other traditional drivers such as interest rate differentials or dairy prices.
As can be seen from the matrix above that tracks the correlation between the NZD/USD exchange rate and various market parameters, stock market performance and implied volatility indicators are among the strongest and most stable influencing factors on the NZD. This means that traders should focus on these two factors when assessing the directional risk of the NZD.
Admittedly, crude oil prices remain important. However, as we have seen recently, the impact of rising oil prices on market sentiment is not as dramatic as it was at the beginning of the Iran conflict. Over the past week, the correlation coefficient between the 2-year and 10-year Treasury yield spreads in the US and Singapore has sent drastically different signals, highlighting that interest rates are currently at best a secondary consideration—or perhaps even completely irrelevant.
Despite clear signals from the correlation matrix, the NZD/USD pair remains range-bound. This indicates that while the NZD's movements are strongly correlated with broader risk appetite, its gains have not matched the rise in the stock market. The 0.5920 level remains a key resistance zone, which appears to have repeatedly rejected bullish attempts over the past month.
On the downside, the 200-day moving average forms the bottom of a key moving average zone. During the same period, each time prices fell to this area, buying support emerged, providing traders with an initial trading range. A daily close above 0.5920 could open the way for moves towards 0.5950 and 0.6000 – both levels have acted as support and resistance in recent months.
Below the 200-day moving average, a series of swing lows can be seen, followed by a more definitive support level at 0.5774. In the current market environment dominated by news, the reference value of technical indicators should be moderately reduced. However, judging from the RSI (14) and MACD, the signals released by both are slightly biased towards a bullish setup, and the current momentum is also slightly biased towards the bulls.
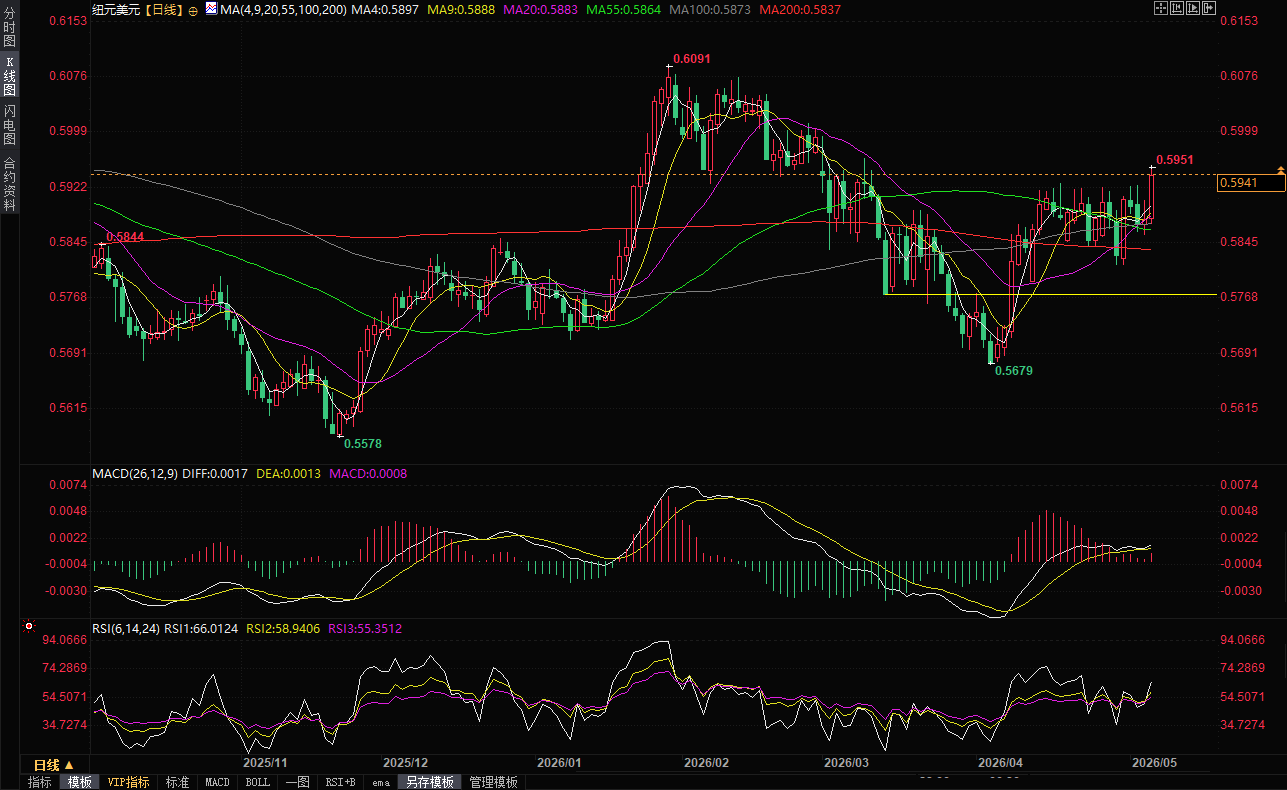
(NZD/USD daily chart, source: FX678)
As for NZD/JPY, the series of higher lows formed over the past week suggests that upside risks may be accumulating in the short term. In early Asian trading, the pair is attempting a clean break above the area where the 50-day moving average meets the 93.00 resistance level.
If the breakout is confirmed, 93.00 can be used as a reference level for establishing long positions—that is, entering above 93.00 and setting a tight stop loss below it, with an initial target of the 94.30 resistance level. If this level is broken further, the bulls may challenge 94.98 and 95.50.
However, any attempt to break through carries the risk of failure—especially considering the possibility of renewed intervention from Japan's Ministry of Finance, as it did around the end of last week. If the breakout fails, 91.35 is a minor support level to watch, below which lies a more substantial support zone, including the upward trendline formed since Liberation Day in April 2025 and the horizontal support level at 90.80.
From the perspective of oscillation indicators, the current signals regarding the release of directional risks are generally neutral. However, the changes in the indicator patterns in recent days suggest that upward momentum may be accumulating again, slightly favoring bullish positioning rather than bearish positioning.
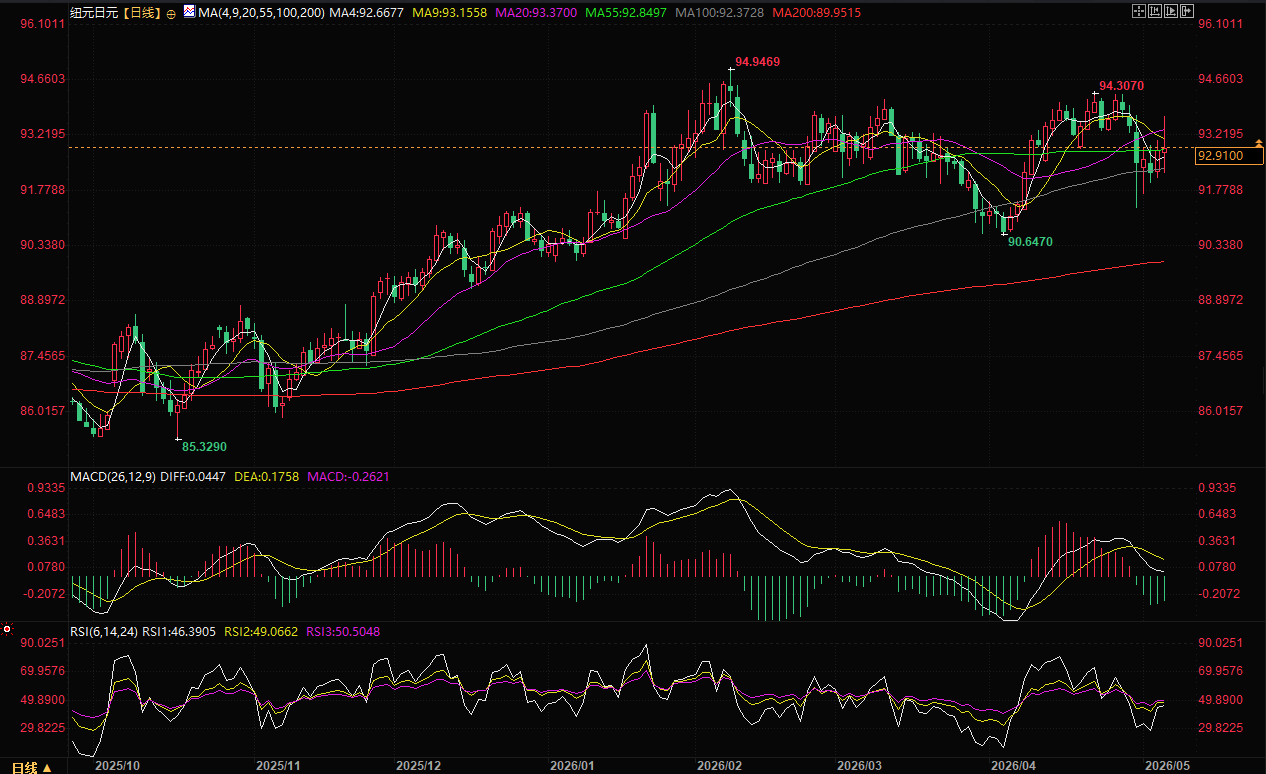
(NZD/JPY daily chart, source: EasyForex)
At 13:30 Beijing time, the New Zealand dollar was trading at 0.5943/45 against the US dollar.
The weakness in the labor market remains evident.
New Zealand's first-quarter labor market data differed from market expectations. The unemployment rate unexpectedly fell to 5.3%, but the underlying details were weak. The quarterly employment growth rate was only 0.2%, lower than expected; the labor force participation rate slightly decreased from 70.5% to 70.4%, indicating that the decline in the unemployment rate was partly due to a decrease in the labor force rather than a significant increase in jobs.
Wage growth was slightly stronger than expected, with private sector labor costs rising 0.5% in the quarter, higher than the market expectation of 0.4%. However, the annual wage growth rate remained at 2%, indicating that underlying wage pressures remain moderate.
The data was mixed, mirroring the Reserve Bank of New Zealand's (RBNZ) first-quarter labor market forecast. Employment growth fell short of the bank's 0.4% forecast, with the actual employment rate at 66.7%, slightly below the expected 66.8%. The unemployment rate met the RBNZ's forecast of 5.3%, while labor costs rose slightly more than the expected 0.4%.
Broader measures continue to point to ample slack in the labor market. The underemployment rate remains high at 12.9%, while the youth NEET rate, which measures the proportion of people aged 15-24 who are not employed, in education, or in training, climbed from 13.3% to 14.4%.
While the labor market downturn may be bottoming out, the recovery remains weak and fragile. This macroeconomic backdrop makes it difficult to compel the Reserve Bank of New Zealand to hastily raise interest rates due to rising energy prices triggered by the situation in Iran.
Following the report's release, the market perceived a 38% probability of the Reserve Bank of New Zealand (RBNZ) raising interest rates later this month. However, given the signals the report conveyed, this expectation appears somewhat aggressive. While the RBNZ's sole mandate is to keep inflation low and stable, it remains questionable whether these energy shocks will generate a significant second wave of inflation, given the current weak demand and apparent labor market slack, unless high energy prices triggered by the Iranian conflict persist for several quarters.
The next key piece of information will be the Reserve Bank of New Zealand's (RBNZ) forecasts survey, released on May 13th, which will update professional forecasters' views on the inflation outlook for the next two years . In February, the two-year inflation expectation was 2.37%, further deviating from the midpoint of the bank's 1%-3% inflation target range. It can be inferred that only a significant acceleration in inflation expectations back to near the upper end of this range will trigger market concerns about an immediate rate hike by the RBNZ in two weeks.
Since the May meeting, the market has fully priced in a July rate hike, with a 90% probability of a second hike in September. The specific trajectory will largely depend on the duration of the Iranian conflict. However, given that the Reserve Bank of New Zealand considers the neutral level for the cash rate to be around 3%, this rate hike path currently appears somewhat aggressive.
While currency markets are still closely watching changes in local data, the New Zealand dollar is not. Currently, the New Zealand dollar's movements are more driven by broader risk appetite than by other traditional drivers such as interest rate differentials or dairy prices.
As can be seen from the matrix above that tracks the correlation between the NZD/USD exchange rate and various market parameters, stock market performance and implied volatility indicators are among the strongest and most stable influencing factors on the NZD. This means that traders should focus on these two factors when assessing the directional risk of the NZD.
Admittedly, crude oil prices remain important. However, as we have seen recently, the impact of rising oil prices on market sentiment is not as dramatic as it was at the beginning of the Iran conflict. Over the past week, the correlation coefficient between the 2-year and 10-year Treasury yield spreads in the US and Singapore has sent drastically different signals, highlighting that interest rates are currently at best a secondary consideration—or perhaps even completely irrelevant.
The NZD/USD pair remains in a range-bound trading pattern.
Despite clear signals from the correlation matrix, the NZD/USD pair remains range-bound. This indicates that while the NZD's movements are strongly correlated with broader risk appetite, its gains have not matched the rise in the stock market. The 0.5920 level remains a key resistance zone, which appears to have repeatedly rejected bullish attempts over the past month.
On the downside, the 200-day moving average forms the bottom of a key moving average zone. During the same period, each time prices fell to this area, buying support emerged, providing traders with an initial trading range. A daily close above 0.5920 could open the way for moves towards 0.5950 and 0.6000 – both levels have acted as support and resistance in recent months.
Below the 200-day moving average, a series of swing lows can be seen, followed by a more definitive support level at 0.5774. In the current market environment dominated by news, the reference value of technical indicators should be moderately reduced. However, judging from the RSI (14) and MACD, the signals released by both are slightly biased towards a bullish setup, and the current momentum is also slightly biased towards the bulls.
(NZD/USD daily chart, source: FX678)
The risk of a breakout in NZD/JPY is accumulating.
As for NZD/JPY, the series of higher lows formed over the past week suggests that upside risks may be accumulating in the short term. In early Asian trading, the pair is attempting a clean break above the area where the 50-day moving average meets the 93.00 resistance level.
If the breakout is confirmed, 93.00 can be used as a reference level for establishing long positions—that is, entering above 93.00 and setting a tight stop loss below it, with an initial target of the 94.30 resistance level. If this level is broken further, the bulls may challenge 94.98 and 95.50.
However, any attempt to break through carries the risk of failure—especially considering the possibility of renewed intervention from Japan's Ministry of Finance, as it did around the end of last week. If the breakout fails, 91.35 is a minor support level to watch, below which lies a more substantial support zone, including the upward trendline formed since Liberation Day in April 2025 and the horizontal support level at 90.80.
From the perspective of oscillation indicators, the current signals regarding the release of directional risks are generally neutral. However, the changes in the indicator patterns in recent days suggest that upward momentum may be accumulating again, slightly favoring bullish positioning rather than bearish positioning.
(NZD/JPY daily chart, source: EasyForex)
At 13:30 Beijing time, the New Zealand dollar was trading at 0.5943/45 against the US dollar.
- Risk Warning and Disclaimer
- The market involves risk, and trading may not be suitable for all investors. This article is for reference only and does not constitute personal investment advice, nor does it take into account certain users’ specific investment objectives, financial situation, or other needs. Any investment decisions made based on this information are at your own risk.