Significant progress has been made on the US-Iran ceasefire memorandum, causing crude oil prices to plummet by over 9%, completely reshaping geopolitical pricing logic.
2026-05-06 18:15:36
On Wednesday (May 6), during the European trading session, a major geopolitical event occurred in the international market. According to an exclusive report by US media Axios, citing Pakistani sources, the United States and Iran are very close to reaching a one-page memorandum aimed at ending the conflict. This is the most conciliatory and closest bilateral negotiation has been since the outbreak of the conflict.
The report clearly disclosed the core framework terms of the memorandum: Iran pledged to suspend its nuclear enrichment activities; the US would agree to gradually lift unilateral sanctions against Iran and release billions of dollars in Iranian assets frozen overseas; and both sides would simultaneously lift restrictions on shipping through the Strait of Hormuz, restoring normal passage along this vital energy route. Axios added that the US anticipates Iran will provide a formal response to the key terms within the next 48 hours. While no formal agreement has been signed at this stage, the breakthrough in negotiations has been confirmed by multiple sources.
This unexpected easing of tensions instantly impacted commodity markets, with international crude oil prices plummeting, falling by more than 9% at one point during the session. For a long period prior, the escalating US-Iran standoff and persistent concerns about shipping disruptions in the Strait of Hormuz had kept oil prices at high levels, coupled with a significant geopolitical risk premium. However, the announcement of the ceasefire memorandum triggered a concentrated withdrawal of safe-haven buying, rapidly squeezing out the geopolitical risk premium and directly causing a precipitous drop in oil prices. The short-term logic of the energy market has completely shifted from "war disruption premium" to "peaceful de-escalation pricing."
Analysis indicates that the core reason for this round of sharp decline in crude oil prices is the concentrated release of geopolitical risk aversion sentiment. The bullish positions accumulated in the early stages due to the Middle East conflict have been liquidated in a concentrated manner. In the short term, there is still room for a downward trend in oil prices due to sentiment, but all of this is based on the premise that the memorandum can be successfully implemented.
Domestic futures institutions are simultaneously reminding investors that crude oil prices are currently entirely driven by geopolitical news, with fundamental supply and demand temporarily taking a backseat. Iran's stance and whether the US and Iran make official announcements within the next 48 hours will directly determine the future direction of oil prices.
Neither the US nor Iran has officially confirmed the matter, nor have any formal signed documents been finalized. The issue remains unconfirmed, yet it has not been officially disproven either. US media reports that a spokesperson for the Iranian Foreign Ministry stated they are "assessing" the 14-point peace plan proposed by Washington.
It's worth noting that the current geopolitical optimism may only be temporary. If US-Iran negotiations fail to make progress, the situation could deteriorate again, pushing up oil prices. The market's two main focuses going forward are: first, whether Iran can respond positively to the core terms of the memorandum in the next 48 hours; and second, even if a verbal agreement is reached, whether subsequent implementation, such as the lifting of sanctions, the resumption of navigation in the Strait of Hormuz, and the suspension of nuclear enrichment, will be subject to wrangling and reneging. Middle East conflicts are historically characterized by repeated negotiations and shifting positions. The memorandum is still a long way from "nearly reached" to "officially implemented," and there is always the possibility of a backsliding of positions, a breakdown in negotiations, or a renewed escalation of tensions.
Overall, the current crude oil and commodity market are completely tied to the US-Iran negotiations. In the short term, oil prices are weak due to expectations of peace, but investors should not excessively short the market. They must closely monitor the progress of the memorandum verification, official statements from both sides, and Iran's key response within 48 hours. If the situation deteriorates again, oil prices will likely begin another volatile rebound.
Currently, this is only based on insider information and has not yet been officially confirmed. The situation is highly volatile, and it is not advisable to be bearish on oil prices. If negotiations change or the news reverses, oil prices could easily recover their losses quickly.
Technical Analysis
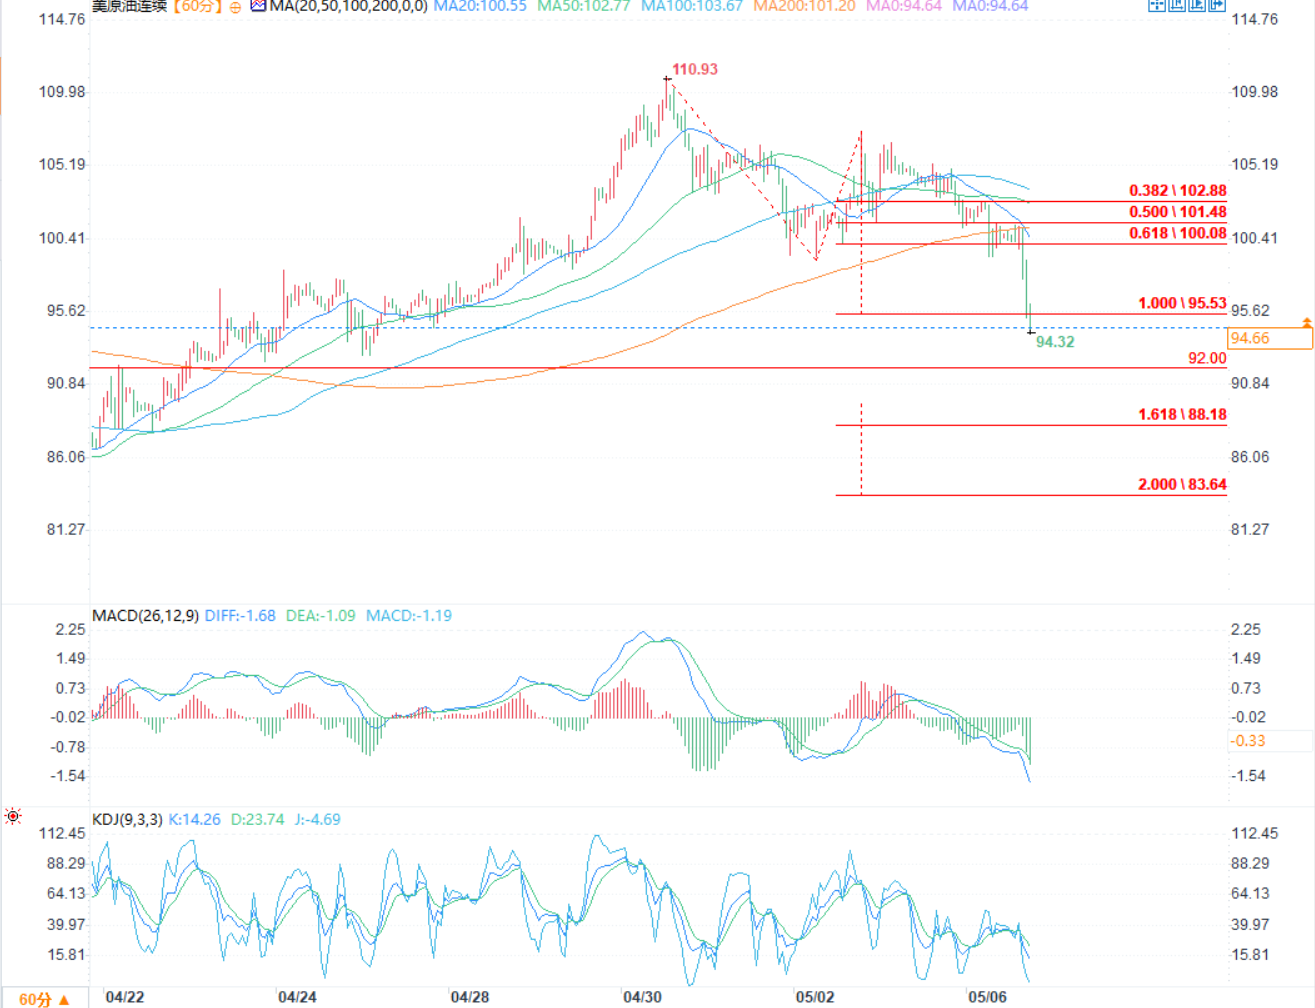
(WTI crude oil daily chart source: FX678)
Currently, US crude oil is in a clear downtrend on the 60-minute chart. Prices have fallen rapidly from a high of 110.93, reaching a low of 94.32, indicating a temporary release of bearish momentum. Looking at momentum indicators, the MACD is running below the zero line; although the green bars haven't completely disappeared, the downward slope has clearly slowed. Meanwhile, the KDJ indicator's J value has fallen to -4.69, placing it in severely oversold territory. This suggests that short-term bearish forces are waning, and the probability of a continued rapid and unresisted decline has significantly decreased. If the market breaks below the 94-95 range (corresponding to 95.53 on the 1.000 level), prices are likely to enter a period of consolidation or correction, rather than a one-sided straight decline.
From the perspective of moving average structure, the current moving averages are in a typical bearish alignment. The death cross resistance zone between the short-term and medium-term moving averages is concentrated in the 100-101.5 range, which highly coincides with the 0.5 (101.48) and 0.382 (102.88) retracement levels marked on the wave scale, forming a dense and strong resistance zone. If the price initiates an oversold rebound, this range will be the core target of the rebound and a key defensive position for the bears. The probability of the price encountering resistance and falling back here is extremely high, making a one-time effective breakthrough unlikely. Therefore, even if a rebound occurs, it is more likely to be a technical correction during the downtrend rather than a trend reversal.
The effectiveness of the support level below will determine the continuation of the trend. Prices may rebound to the 94-95 range after the sharp drop. If this level holds, prices will likely enter a sideways consolidation phase between 94-98 to correct oversold indicators. If the support is breached, the next key support level is the previous low of 92.00, a significant target for the bears. If 92.00 is also decisively broken, the downtrend will continue, and prices will likely move towards the 88.18 level (corresponding to the 1.618 Fibonacci retracement), opening up further downside potential.
Overall, the market is currently in a weak equilibrium phase after the decline. In the short term, it will mainly fluctuate or rebound weakly, while the medium-term trend is still dominated by the bears. The breakthrough of key support and resistance levels will be the core signal for the subsequent direction.
At 18:06 Beijing time, WTI crude oil was trading at $92.69 per ounce, down 9.37%.
The report clearly disclosed the core framework terms of the memorandum: Iran pledged to suspend its nuclear enrichment activities; the US would agree to gradually lift unilateral sanctions against Iran and release billions of dollars in Iranian assets frozen overseas; and both sides would simultaneously lift restrictions on shipping through the Strait of Hormuz, restoring normal passage along this vital energy route. Axios added that the US anticipates Iran will provide a formal response to the key terms within the next 48 hours. While no formal agreement has been signed at this stage, the breakthrough in negotiations has been confirmed by multiple sources.
This unexpected easing of tensions instantly impacted commodity markets, with international crude oil prices plummeting, falling by more than 9% at one point during the session. For a long period prior, the escalating US-Iran standoff and persistent concerns about shipping disruptions in the Strait of Hormuz had kept oil prices at high levels, coupled with a significant geopolitical risk premium. However, the announcement of the ceasefire memorandum triggered a concentrated withdrawal of safe-haven buying, rapidly squeezing out the geopolitical risk premium and directly causing a precipitous drop in oil prices. The short-term logic of the energy market has completely shifted from "war disruption premium" to "peaceful de-escalation pricing."
Analysis indicates that the core reason for this round of sharp decline in crude oil prices is the concentrated release of geopolitical risk aversion sentiment. The bullish positions accumulated in the early stages due to the Middle East conflict have been liquidated in a concentrated manner. In the short term, there is still room for a downward trend in oil prices due to sentiment, but all of this is based on the premise that the memorandum can be successfully implemented.
Domestic futures institutions are simultaneously reminding investors that crude oil prices are currently entirely driven by geopolitical news, with fundamental supply and demand temporarily taking a backseat. Iran's stance and whether the US and Iran make official announcements within the next 48 hours will directly determine the future direction of oil prices.
Neither the US nor Iran has officially confirmed the matter, nor have any formal signed documents been finalized. The issue remains unconfirmed, yet it has not been officially disproven either. US media reports that a spokesperson for the Iranian Foreign Ministry stated they are "assessing" the 14-point peace plan proposed by Washington.
It's worth noting that the current geopolitical optimism may only be temporary. If US-Iran negotiations fail to make progress, the situation could deteriorate again, pushing up oil prices. The market's two main focuses going forward are: first, whether Iran can respond positively to the core terms of the memorandum in the next 48 hours; and second, even if a verbal agreement is reached, whether subsequent implementation, such as the lifting of sanctions, the resumption of navigation in the Strait of Hormuz, and the suspension of nuclear enrichment, will be subject to wrangling and reneging. Middle East conflicts are historically characterized by repeated negotiations and shifting positions. The memorandum is still a long way from "nearly reached" to "officially implemented," and there is always the possibility of a backsliding of positions, a breakdown in negotiations, or a renewed escalation of tensions.
Overall, the current crude oil and commodity market are completely tied to the US-Iran negotiations. In the short term, oil prices are weak due to expectations of peace, but investors should not excessively short the market. They must closely monitor the progress of the memorandum verification, official statements from both sides, and Iran's key response within 48 hours. If the situation deteriorates again, oil prices will likely begin another volatile rebound.
Currently, this is only based on insider information and has not yet been officially confirmed. The situation is highly volatile, and it is not advisable to be bearish on oil prices. If negotiations change or the news reverses, oil prices could easily recover their losses quickly.
Technical Analysis
(WTI crude oil daily chart source: FX678)
Currently, US crude oil is in a clear downtrend on the 60-minute chart. Prices have fallen rapidly from a high of 110.93, reaching a low of 94.32, indicating a temporary release of bearish momentum. Looking at momentum indicators, the MACD is running below the zero line; although the green bars haven't completely disappeared, the downward slope has clearly slowed. Meanwhile, the KDJ indicator's J value has fallen to -4.69, placing it in severely oversold territory. This suggests that short-term bearish forces are waning, and the probability of a continued rapid and unresisted decline has significantly decreased. If the market breaks below the 94-95 range (corresponding to 95.53 on the 1.000 level), prices are likely to enter a period of consolidation or correction, rather than a one-sided straight decline.
From the perspective of moving average structure, the current moving averages are in a typical bearish alignment. The death cross resistance zone between the short-term and medium-term moving averages is concentrated in the 100-101.5 range, which highly coincides with the 0.5 (101.48) and 0.382 (102.88) retracement levels marked on the wave scale, forming a dense and strong resistance zone. If the price initiates an oversold rebound, this range will be the core target of the rebound and a key defensive position for the bears. The probability of the price encountering resistance and falling back here is extremely high, making a one-time effective breakthrough unlikely. Therefore, even if a rebound occurs, it is more likely to be a technical correction during the downtrend rather than a trend reversal.
The effectiveness of the support level below will determine the continuation of the trend. Prices may rebound to the 94-95 range after the sharp drop. If this level holds, prices will likely enter a sideways consolidation phase between 94-98 to correct oversold indicators. If the support is breached, the next key support level is the previous low of 92.00, a significant target for the bears. If 92.00 is also decisively broken, the downtrend will continue, and prices will likely move towards the 88.18 level (corresponding to the 1.618 Fibonacci retracement), opening up further downside potential.
Overall, the market is currently in a weak equilibrium phase after the decline. In the short term, it will mainly fluctuate or rebound weakly, while the medium-term trend is still dominated by the bears. The breakthrough of key support and resistance levels will be the core signal for the subsequent direction.
At 18:06 Beijing time, WTI crude oil was trading at $92.69 per ounce, down 9.37%.
- Risk Warning and Disclaimer
- The market involves risk, and trading may not be suitable for all investors. This article is for reference only and does not constitute personal investment advice, nor does it take into account certain users’ specific investment objectives, financial situation, or other needs. Any investment decisions made based on this information are at your own risk.