US Dollar Analysis: The US Dollar Index Continues to Weaken
2026-05-06 20:01:29
The US dollar index continued its downward pressure on Wednesday (May 6), briefly touching a daily low of 97.62 before rebounding slightly, and generally remaining within a weak range of 98.00 to 98.30. This movement ended its previous three-day winning streak, with a cumulative monthly decline of approximately 1% to 2%. Market sentiment indicates that investors' demand for safe-haven assets is clearly cooling, with funds gradually flowing from the dollar to risk assets, and the dollar's strong position is being challenged by multiple factors.
The core driver of the weakening dollar stems from the continued easing of geopolitical tensions in the Middle East. The US-Iran ceasefire agreement has been in place for approximately one month, and tanker traffic in the Strait of Hormuz has largely returned to normal with no major incidents reported, leading to a significant improvement in global risk sentiment. As the situation stabilizes, market reliance on the dollar as a safe-haven asset has decreased substantially, and the dollar's safe-haven premium has diminished. The euro has strengthened due to improved energy conditions in Europe, while the pound has performed well amid rising risk appetite, both attracting some funds flowing out of the dollar. Of particular note are the recent visits by the Iranian foreign minister to Russia and China. Trump reportedly hopes to secure an agreement before his visit to China in mid-May, a diplomatic development that has further boosted market optimism.
Meanwhile, shifts in global capital flows are also accelerating the downward pressure on the US dollar. Asian stocks performed strongly on Wednesday, with the South Korean Kospi index surging about 7% on news of expanded access for foreign investors, leading to an appreciation of the won. Chinese stocks also strengthened, with positive April economic data pushing the yuan to an annual low, and the dollar-yuan exchange rate approaching 6.81. ETF flow data shows that while investors have slowed their investment in emerging markets since the Gulf crisis, they haven't truly withdrawn, indicating continued confidence in the long-term prospects of these markets. When the overall environment in emerging markets improves, the dollar tends to weaken, mirroring the market pattern observed in the first quarter of the year.
From a fundamental perspective, expectations surrounding the Federal Reserve's policy remain a significant support for the US dollar. The Fed is currently maintaining relatively high interest rates to address persistent inflationary pressures, particularly the transmission effects of tariff policies in 2025—it is estimated that tariffs have already pushed up core goods PCE by approximately 3.1%, with overall core PCE rising by about 0.8%. This inflation stickiness provides a floor for the dollar to some extent, but it is currently being suppressed by improved risk appetite resulting from geopolitical easing.
The market is currently focused on the ADP non-farm payroll data to be released at 20:15 Beijing time today. April is expected to see approximately 120,000 new jobs, significantly higher than the previous figure of 62,000. If the data significantly exceeds expectations, it will strengthen economic resilience and tightening expectations, providing upward momentum for the US dollar; conversely, if the data falls short of expectations, it could further exacerbate downward pressure on the dollar. In addition, the weekly crude oil inventory data released by the US Energy Information Administration on the same day is also closely watched. Inventories are expected to decrease by 2.4 million barrels this week. If the actual decrease significantly exceeds expectations, oil prices may surge again, and the resurgence of inflation expectations will bring new uncertainties to the market.
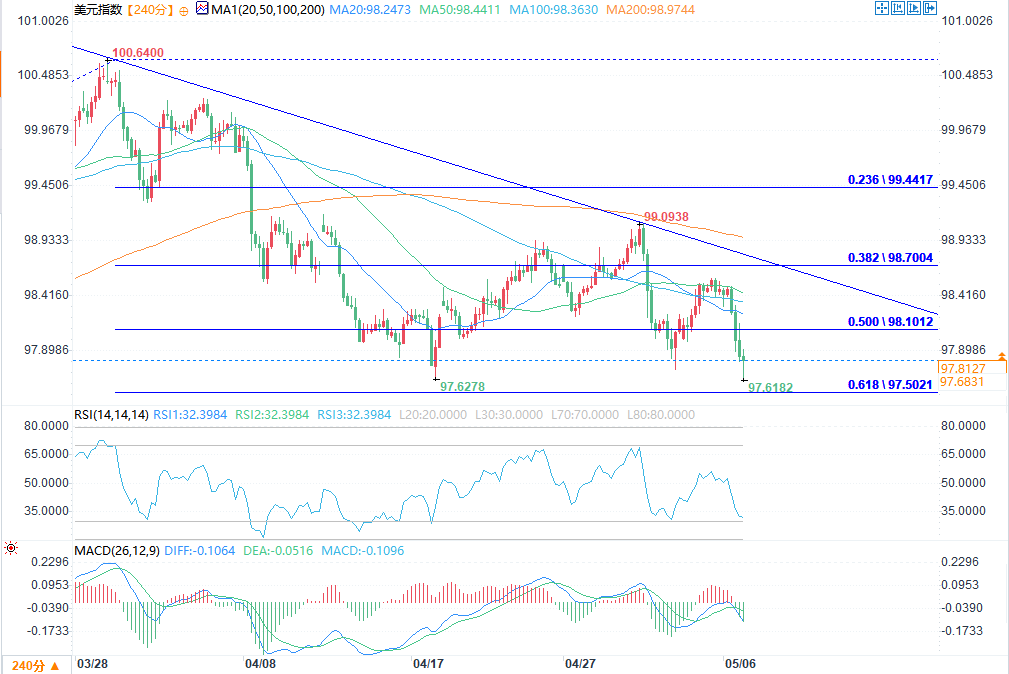
From a technical perspective, the US dollar index is currently trading around 97.83 on the 4-hour chart, having clearly broken below the 50-period moving average and the key support level of 98.44, forming a typical bearish engulfing pattern. The price continues the downtrend line since April, exhibiting a consistently lower high, lower low structure, and a complete downward channel. The RSI indicator is currently below 33, clearly showing bearish momentum and approaching oversold territory, indicating that the downward momentum has been released.
The Fibonacci retracement level points to the next key support zone between 97.50 and 96.65. A break below the recent low of 97.61 could see prices move towards this range. On the upside, 98.44 has now turned from support into resistance, and as long as prices remain below 98.60, the overall downtrend is unlikely to change, and any technical rebound will face resistance from the upper channel line.
In summary, the US dollar is currently in a passive position due to multiple negative factors. The most direct suppressive factor is the easing of geopolitical tensions, while the recovery in global risk appetite and the repatriation of funds from emerging markets are continuously weakening the dollar's relative attractiveness. However, it is important to emphasize that the current ceasefire agreement remains quite fragile. If the situation in the Middle East reverts, risk aversion could surge instantly, and the dollar would rebound sharply. Therefore, investors need to closely monitor geopolitical developments, ADP employment data, and the latest statements from Federal Reserve officials. The combined signal of these three factors will determine whether the dollar continues to decline or undergoes a phase of recovery.
At 19:18 Beijing time, the US dollar index was at 97.7214, down 0.78%.
The core driver of the weakening dollar stems from the continued easing of geopolitical tensions in the Middle East. The US-Iran ceasefire agreement has been in place for approximately one month, and tanker traffic in the Strait of Hormuz has largely returned to normal with no major incidents reported, leading to a significant improvement in global risk sentiment. As the situation stabilizes, market reliance on the dollar as a safe-haven asset has decreased substantially, and the dollar's safe-haven premium has diminished. The euro has strengthened due to improved energy conditions in Europe, while the pound has performed well amid rising risk appetite, both attracting some funds flowing out of the dollar. Of particular note are the recent visits by the Iranian foreign minister to Russia and China. Trump reportedly hopes to secure an agreement before his visit to China in mid-May, a diplomatic development that has further boosted market optimism.
Meanwhile, shifts in global capital flows are also accelerating the downward pressure on the US dollar. Asian stocks performed strongly on Wednesday, with the South Korean Kospi index surging about 7% on news of expanded access for foreign investors, leading to an appreciation of the won. Chinese stocks also strengthened, with positive April economic data pushing the yuan to an annual low, and the dollar-yuan exchange rate approaching 6.81. ETF flow data shows that while investors have slowed their investment in emerging markets since the Gulf crisis, they haven't truly withdrawn, indicating continued confidence in the long-term prospects of these markets. When the overall environment in emerging markets improves, the dollar tends to weaken, mirroring the market pattern observed in the first quarter of the year.
From a fundamental perspective, expectations surrounding the Federal Reserve's policy remain a significant support for the US dollar. The Fed is currently maintaining relatively high interest rates to address persistent inflationary pressures, particularly the transmission effects of tariff policies in 2025—it is estimated that tariffs have already pushed up core goods PCE by approximately 3.1%, with overall core PCE rising by about 0.8%. This inflation stickiness provides a floor for the dollar to some extent, but it is currently being suppressed by improved risk appetite resulting from geopolitical easing.
The market is currently focused on the ADP non-farm payroll data to be released at 20:15 Beijing time today. April is expected to see approximately 120,000 new jobs, significantly higher than the previous figure of 62,000. If the data significantly exceeds expectations, it will strengthen economic resilience and tightening expectations, providing upward momentum for the US dollar; conversely, if the data falls short of expectations, it could further exacerbate downward pressure on the dollar. In addition, the weekly crude oil inventory data released by the US Energy Information Administration on the same day is also closely watched. Inventories are expected to decrease by 2.4 million barrels this week. If the actual decrease significantly exceeds expectations, oil prices may surge again, and the resurgence of inflation expectations will bring new uncertainties to the market.
From a technical perspective, the US dollar index is currently trading around 97.83 on the 4-hour chart, having clearly broken below the 50-period moving average and the key support level of 98.44, forming a typical bearish engulfing pattern. The price continues the downtrend line since April, exhibiting a consistently lower high, lower low structure, and a complete downward channel. The RSI indicator is currently below 33, clearly showing bearish momentum and approaching oversold territory, indicating that the downward momentum has been released.
The Fibonacci retracement level points to the next key support zone between 97.50 and 96.65. A break below the recent low of 97.61 could see prices move towards this range. On the upside, 98.44 has now turned from support into resistance, and as long as prices remain below 98.60, the overall downtrend is unlikely to change, and any technical rebound will face resistance from the upper channel line.
In summary, the US dollar is currently in a passive position due to multiple negative factors. The most direct suppressive factor is the easing of geopolitical tensions, while the recovery in global risk appetite and the repatriation of funds from emerging markets are continuously weakening the dollar's relative attractiveness. However, it is important to emphasize that the current ceasefire agreement remains quite fragile. If the situation in the Middle East reverts, risk aversion could surge instantly, and the dollar would rebound sharply. Therefore, investors need to closely monitor geopolitical developments, ADP employment data, and the latest statements from Federal Reserve officials. The combined signal of these three factors will determine whether the dollar continues to decline or undergoes a phase of recovery.
At 19:18 Beijing time, the US dollar index was at 97.7214, down 0.78%.
- Risk Warning and Disclaimer
- The market involves risk, and trading may not be suitable for all investors. This article is for reference only and does not constitute personal investment advice, nor does it take into account certain users’ specific investment objectives, financial situation, or other needs. Any investment decisions made based on this information are at your own risk.