Is the Hormuz Agreement imminent? Market dynamics after a 10% plunge in crude oil prices.
2026-05-06 19:46:28
On Wednesday, May 6th, the international crude oil market experienced significant volatility. Brent crude oil futures contracts plunged to $96.75 per barrel before stabilizing around $98 per barrel, a daily drop of 11.2%. WTI crude oil also recorded a decline of nearly 11% during the same period. European natural gas prices simultaneously plummeted by as much as 11%. This sharp decline was primarily driven by market expectations of a potential agreement between the US and Iran to end the conflict, with geopolitical risk premiums rapidly diminishing.
API data showed that U.S. crude oil inventories fell by 8.1 million barrels last week, the largest weekly decline since mid-February, but the positive news failed to offset the selling pressure brought by expectations of an agreement. Since the conflict broke out at the end of February, crude oil prices have risen by about 40%. The double blockade of the Strait of Hormuz has led to a significant tightening of global supply, and market sentiment has already priced in the prospect of supply recovery should a potential agreement be reached.

Current oil price movements are entirely driven by sentiment shifts, rather than immediate fundamental equilibrium. UBS analysis points out that oil prices reflect market expectations of a potential agreement, rather than actual supply and demand. The Strait of Hormuz, a crucial chokepoint for global oil transportation, previously saw billions of barrels of Persian Gulf crude oil shipments disrupted due to conflict, directly pushing up global oil prices by approximately 40%. Following the announcement of the agreement, traders quickly closed out long positions, causing intraday volatility far exceeding that of regular trading sessions. Brent crude has retreated from its recent high of $115.21 per barrel to current levels, demonstrating the market's extremely high sensitivity to peace expectations. It is important to note that any actual supply recovery has a significant time lag; the agreement itself is still in the negotiation stage and a formal memorandum has not yet been signed. The US expects Iran to respond within 48 hours, but even if a consensus is reached, the resumption of navigation through the Strait will still require time to verify.
The United States and Iran are close to reaching a brief memorandum to end the nearly 10-week conflict. The core of the memorandum includes the lifting of restrictions on the Strait of Hormuz. US President Trump stated that he has suspended US escort efforts to monitor progress on the agreement, and said that significant progress has been made towards a final agreement. US Secretary of State Marco Rubio announced the end of "Operation Epic Fury," stating that the operation's objectives had been achieved. Defense Secretary Pete Hegseth confirmed that the ceasefire agreement remains in effect, and Joint Chiefs of Staff Chairman General Dan Caine pointed out that Iran's previous attacks on ships in the Persian Gulf and energy facilities in the UAE did not violate the ceasefire terms. Currently, more than 1,550 commercial vessels and approximately 22,000 crew members are stranded in the Persian Gulf. Pakistani Prime Minister Shehbaz Sharif, acting as a mediator, expressed optimism on social media that the current momentum could lead to a lasting agreement. Equinor CFO Torgrim Reitan stated that once the Strait is open, it is expected to take six months for crude oil supplies to return to normal levels, and even longer for natural gas. The previous blockade of the Straits had already reduced global liquefied natural gas supply by one-fifth, increasing the pressure on Europe to replenish its winter stocks and further intensifying global competition for maritime energy resources.
While geopolitical expectations dominate short-term prices, fundamental data still indicates supply-side support. The US API inventory report showed that crude oil inventories fell by 8.1 million barrels last week, far exceeding market expectations. If subsequent official data confirms this, it will be the largest weekly decline since mid-February, reflecting a recovery in refinery utilization rates and continued strong exports. The following is a comparison of recent key data:
The significant reduction in inventories indicates that the actual supply remains tight, but this situation will gradually ease after the agreement is implemented and Persian Gulf crude oil shipments resume. Traders need to pay attention to subsequent official inventory data and refinery processing volumes to determine whether the reduction trend can continue. Disruptions to global liquefied natural gas (LNG) supply also indirectly affect the overall energy market balance, and European inventory replenishment demand may push up alternative energy prices before winter.
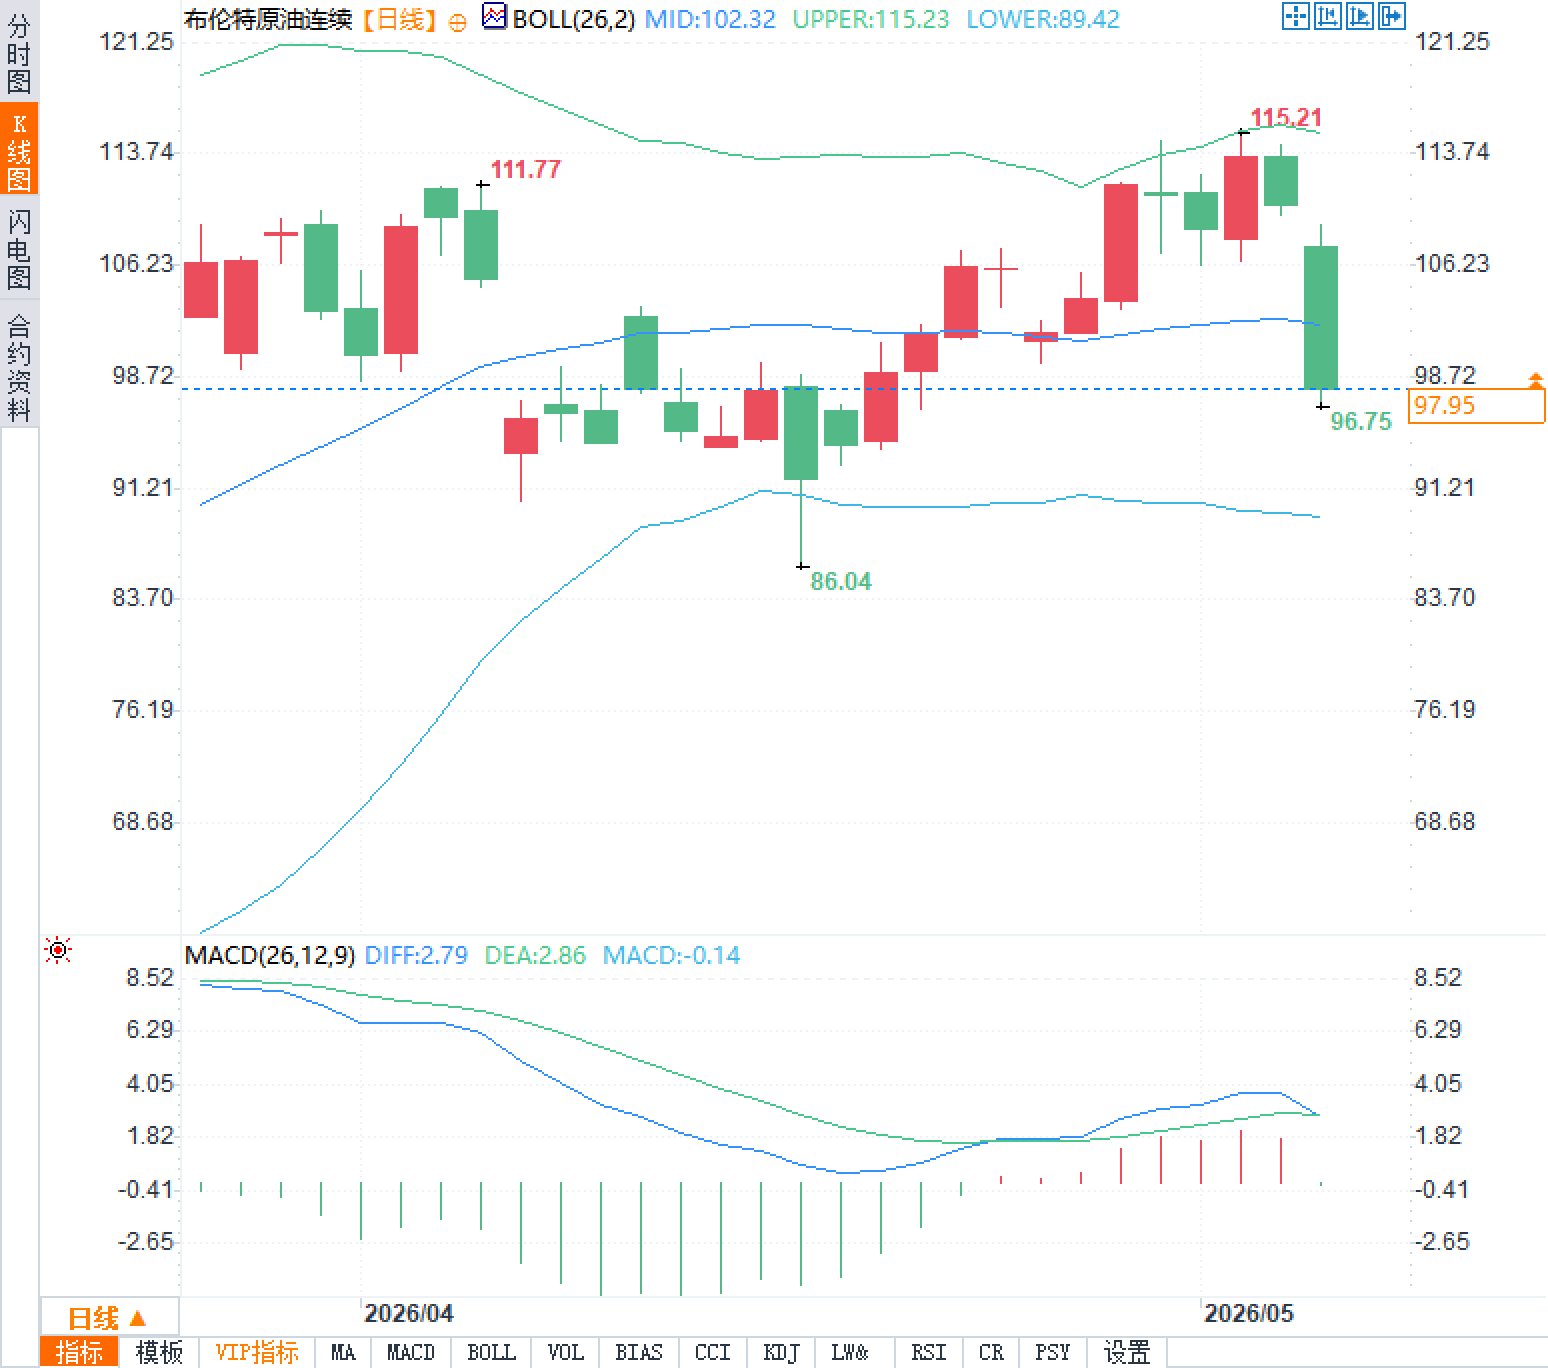
From the daily chart, the Brent crude oil futures contract is currently trading near the lower Bollinger Band. The middle Bollinger Band is at $102.32/barrel, the upper band is at $115.23/barrel, and the lower band is at $89.42/barrel. The latest price has broken below the middle band, indicating strong downward momentum in the short term, but there is some support near the lower band. Overall, the technical picture is in a downward channel. In the short term, pay attention to the support level around $97/barrel, while the middle band at $102.32/barrel is a significant resistance level for any rebound.
API data showed that U.S. crude oil inventories fell by 8.1 million barrels last week, the largest weekly decline since mid-February, but the positive news failed to offset the selling pressure brought by expectations of an agreement. Since the conflict broke out at the end of February, crude oil prices have risen by about 40%. The double blockade of the Strait of Hormuz has led to a significant tightening of global supply, and market sentiment has already priced in the prospect of supply recovery should a potential agreement be reached.
Oil prices have fallen sharply as geopolitical risk premiums have receded rapidly.
Current oil price movements are entirely driven by sentiment shifts, rather than immediate fundamental equilibrium. UBS analysis points out that oil prices reflect market expectations of a potential agreement, rather than actual supply and demand. The Strait of Hormuz, a crucial chokepoint for global oil transportation, previously saw billions of barrels of Persian Gulf crude oil shipments disrupted due to conflict, directly pushing up global oil prices by approximately 40%. Following the announcement of the agreement, traders quickly closed out long positions, causing intraday volatility far exceeding that of regular trading sessions. Brent crude has retreated from its recent high of $115.21 per barrel to current levels, demonstrating the market's extremely high sensitivity to peace expectations. It is important to note that any actual supply recovery has a significant time lag; the agreement itself is still in the negotiation stage and a formal memorandum has not yet been signed. The US expects Iran to respond within 48 hours, but even if a consensus is reached, the resumption of navigation through the Strait will still require time to verify.
US-Iran diplomatic progress and prospects for the Strait of Hormuz
The United States and Iran are close to reaching a brief memorandum to end the nearly 10-week conflict. The core of the memorandum includes the lifting of restrictions on the Strait of Hormuz. US President Trump stated that he has suspended US escort efforts to monitor progress on the agreement, and said that significant progress has been made towards a final agreement. US Secretary of State Marco Rubio announced the end of "Operation Epic Fury," stating that the operation's objectives had been achieved. Defense Secretary Pete Hegseth confirmed that the ceasefire agreement remains in effect, and Joint Chiefs of Staff Chairman General Dan Caine pointed out that Iran's previous attacks on ships in the Persian Gulf and energy facilities in the UAE did not violate the ceasefire terms. Currently, more than 1,550 commercial vessels and approximately 22,000 crew members are stranded in the Persian Gulf. Pakistani Prime Minister Shehbaz Sharif, acting as a mediator, expressed optimism on social media that the current momentum could lead to a lasting agreement. Equinor CFO Torgrim Reitan stated that once the Strait is open, it is expected to take six months for crude oil supplies to return to normal levels, and even longer for natural gas. The previous blockade of the Straits had already reduced global liquefied natural gas supply by one-fifth, increasing the pressure on Europe to replenish its winter stocks and further intensifying global competition for maritime energy resources.
Crude oil supply and demand fundamentals: Inventory data releases positive signals
While geopolitical expectations dominate short-term prices, fundamental data still indicates supply-side support. The US API inventory report showed that crude oil inventories fell by 8.1 million barrels last week, far exceeding market expectations. If subsequent official data confirms this, it will be the largest weekly decline since mid-February, reflecting a recovery in refinery utilization rates and continued strong exports. The following is a comparison of recent key data:
| index | Latest value | Previous value / expected value | change |
|---|---|---|---|
| API Crude Oil Inventory Changes | -8.1 million barrels | Market expectations increased slightly | Significantly exceeded expectations |
| Brent crude oil price | $98/barrel | Recent high: $115.21 per barrel | -11.2% (intraday) |
| WTI crude oil | Nearly 11% drop | Pre-conflict level | After a cumulative increase of 40%, a pullback occurred. |
Technical Analysis
From the daily chart, the Brent crude oil futures contract is currently trading near the lower Bollinger Band. The middle Bollinger Band is at $102.32/barrel, the upper band is at $115.23/barrel, and the lower band is at $89.42/barrel. The latest price has broken below the middle band, indicating strong downward momentum in the short term, but there is some support near the lower band. Overall, the technical picture is in a downward channel. In the short term, pay attention to the support level around $97/barrel, while the middle band at $102.32/barrel is a significant resistance level for any rebound.
Frequently Asked Questions
Question 1: What are the differences between the short-term and long-term time lags in the impact of a potential US-Iran agreement on oil prices?
A: In the short term, the news of the agreement directly triggered a reversal in sentiment, causing oil prices to fall rapidly by more than 10%, and the risk premium to be compressed significantly. However, the actual supply recovery will take about six months, as the opening of the strait, the dispersal of ships, and the resumption of production all require time, during which oil prices may fluctuate repeatedly.
Question 2: Why did the sharp drop in API inventories fail to support oil prices?
A: While the API inventory reduction of 8.1 million barrels is positive, the market has already priced in the massive supply release resulting from the peace agreement, with sentiment outweighing fundamental data. Inventory reduction reflects the current tight balance, not expectations of future easing. Traders are more focused on changes in the supply curve after the agreement is implemented than on a single week's data.
- Risk Warning and Disclaimer
- The market involves risk, and trading may not be suitable for all investors. This article is for reference only and does not constitute personal investment advice, nor does it take into account certain users’ specific investment objectives, financial situation, or other needs. Any investment decisions made based on this information are at your own risk.