Gold's rebound encountered resistance at a key moving average, and the short-term bearish trend remains unchanged.
2026-05-07 19:17:24
On Thursday (May 7th) during the European session, spot gold traded in a volatile upward trend followed by a pullback. After opening at 4693, it dipped to a low of 4685.20 before rebounding strongly, driven by a weaker dollar, reaching a high of 4753.30. The intraday price was 4737.09, representing a daily gain of 0.99% and a volatility of 1.45%. Short-term bullish momentum remains, but a slight pullback after the afternoon surge warrants caution regarding short-term profit-taking pressure.
Fundamental Analysis
The current fundamentals for gold are mixed, with key influencing variables concentrated in four dimensions: the US-Iran geopolitical situation, the Federal Reserve's policy direction, fluctuations in US Treasury yields, and global central bank activities. A detailed analysis follows:
In terms of geopolitics, the easing of tensions between the US and Iran is the core catalyst for the recent gold price rebound. Positive signals emerged from the US-Iran situation on May 5th, increasing market expectations for a peace agreement and driving spot gold to gradually rebound from a near one-month low of $4500.94/oz on May 4th, reaching a high of $4753.30/oz on May 7th. However, it should be noted that geopolitical tensions may still fluctuate, and previously, when the conflict escalated, gold prices did not rise in tandem; instead, they were pressured by soaring oil prices, which exacerbated inflation stickiness and forced the Federal Reserve to maintain high interest rates. This indicates that geopolitical factors have limited support for gold.
At the Federal Reserve policy level, the latest developments show significant divergence, becoming a key influencing variable. On April 29, the Fed maintained the federal funds rate at 3.50%-3.75%, but the internal division within the Federal Open Market Committee (FOMC) was the largest since 1992. Of the 12 members, 8 supported maintaining the rate, 1 advocated a 25 basis point cut, and 3 opposed an easing stance. Currently, global investment banks have divergent expectations for the Fed's policy path in 2026. Some predict a 50 basis point rate cut this year, while others believe there will be no cut, and some institutions even predict a rate hike in the first half of 2027. This divergence has caused market volatility in the pricing of the dollar and gold, making it difficult to establish a clear trend in the short term.
Regarding US Treasury yields, the recent slight decline has somewhat eased the pressure on gold but it remains resilient. On May 7th, the yield on the 10-year US Treasury note fell 14 basis points to 4.337% intraday, reducing the opportunity cost of holding gold to some extent and providing weak support for a rebound. However, overall, the US 10-year real yield is still approaching the high interest rate threshold of 2%, and the neutral-to-high yield level has long limited the upward momentum of gold. If the yield rebounds to test the recent resistance level of 1.98%, it will still put downward pressure on gold prices.
Furthermore, global central bank actions and market demand exhibited divergent characteristics. Most major central banks maintained their interest rates unchanged, while the European Central Bank remained divided on rate hikes. The Reserve Bank of Australia raised rates for the third consecutive time by 25 basis points to 4.35%, and the Bank of Japan raised its inflation forecast. This policy divergence exacerbated global liquidity uncertainty. On the consumption side, the domestic gold market was sluggish. During the May Day holiday, the price of branded gold jewelry generally fell below 1400 yuan/gram, but the "buy high, sell low" mentality prevented a significant release of demand. On the investment side, there was divergence: medium- to long-term allocation funds viewed pullbacks as opportunities to buy, while short-term funds focused on fluctuations in core pricing variables, resulting in an overall cautious market sentiment.
Specifically, on Wednesday, May 6th, amid easing geopolitical tensions between the US and Iran, international spot gold rose nearly 3% in a single day. It is understood that a peace agreement is expected to be reached in the two-month-long US-Iran conflict, and this expectation has become the core driver of the gold price increase. From a market perspective, the end of the US-Iran conflict will reduce the risk of global stagflation, leading to a decline in oil prices and easing inflationary pressures. This will provide the Federal Reserve with room to adjust its policies. If the Fed turns dovish, it will weaken the attractiveness of the dollar, push down the dollar index, and thus improve the cost-effectiveness of gold, theoretically benefiting gold prices.
However, from a longer-term perspective, the gold rebound has not changed the overall weak trend. Between February 27, 2026 (the pre-war benchmark date) and May 6, the London Bullion Market Association (LMBA) spot gold fell by 9.9% cumulatively, significantly underperforming other core assets, confirming that although short-term geopolitical factors have driven a rebound, gold has not yet escaped its medium-term weakness.
Further analysis from a technical and cross-market perspective reveals that even after the significant 3% rebound on May 6th, gold (XAU/USD) has not yet entered a medium-term upward phase. The short-term rebound is more like a phase correction within a weak market, rather than a trend reversal.
Technical Analysis: After testing the 20-day moving average, the bullish momentum has significantly weakened.
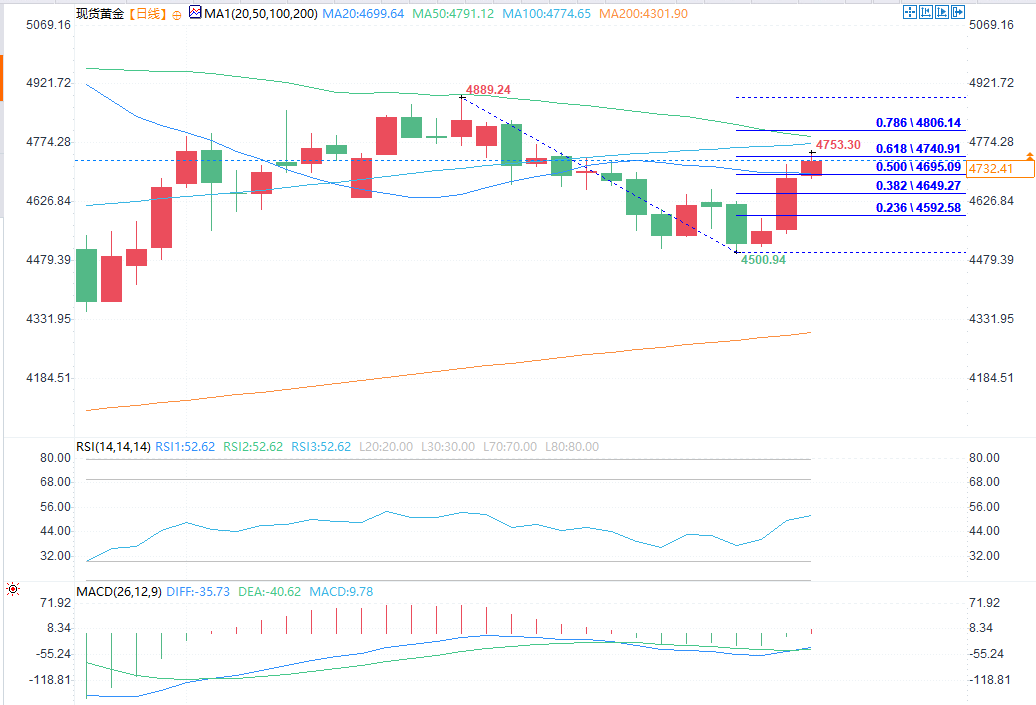
(Spot gold daily chart source: EasyForex)
From a short-term perspective, since gold entered a range-bound trading pattern from April 17th to April 19th, 2026, the overall trend has been bearish. $4775/oz serves as a key short-term resistance level, and whether it is broken or not will directly determine whether the short-term bearish trend can continue. Current support levels for gold are mainly concentrated at $4645/oz, $4580/oz, and the $4524-$4486/oz support zone. Subsequent resistance levels point to the $4860-$4900/oz range, which corresponds to the previous high from April 15th to April 17th and is a significant resistance area for any short-term rebound.
Key factors supporting a short-term bearish outlook for gold
Based on comprehensive technical indicators, three core factors support a short-term bearish view on gold, confirming that the rebound is unlikely to be sustained:
Firstly, the rebound encountered resistance at key moving averages. Gold's recent rebound from the May 5th low stalled near the downward-sloping 20-day and 50-day moving averages. These two moving averages, important references for short-term trends, are currently trending downwards, forming strong resistance, meaning the short-term rebound momentum is insufficient to break through this resistance.
Secondly, it's approaching a key Fibonacci retracement level. This rebound has nearly reached the 61.8% Fibonacci retracement level of the previous decline—the range from the April 17 high to the May 5 low, corresponding to approximately $4740 per ounce. From a technical perspective, the 61.8% retracement level is crucial in distinguishing between a correction and a reversal. If it fails to break through effectively, the rebound may end, and gold prices will likely return to a downward trend.
Third, the RSI indicator shows a bearish divergence. The hourly Relative Strength Index (RSI) has fallen back from the overbought zone (above 70), and there was a clear bearish divergence previously – gold prices rebounded, but the RSI did not reach a new high in tandem and instead gradually declined. This means that the bullish momentum is rapidly weakening, and selling pressure may be coming soon, which is an important warning sign of short-term downward pressure.
Overall, although the easing of geopolitical tensions between the US and Iran has driven a temporary rebound in gold prices, core factors such as technical resistance and high real yields remain unchanged, and the short-term bearish trend remains intact. Going forward, key attention should be paid to whether the key resistance level of $4775/oz is broken, as well as the trend of the US 10-year real yield. If the resistance level is not broken and yields continue to rise, gold will likely return to its downward trend to test lower support levels. If the resistance is unexpectedly broken, a short-term correction should be anticipated.
At 19:10 Beijing time, spot gold was trading at $4,733.02 per ounce, up 0.90%.
Fundamental Analysis
The current fundamentals for gold are mixed, with key influencing variables concentrated in four dimensions: the US-Iran geopolitical situation, the Federal Reserve's policy direction, fluctuations in US Treasury yields, and global central bank activities. A detailed analysis follows:
In terms of geopolitics, the easing of tensions between the US and Iran is the core catalyst for the recent gold price rebound. Positive signals emerged from the US-Iran situation on May 5th, increasing market expectations for a peace agreement and driving spot gold to gradually rebound from a near one-month low of $4500.94/oz on May 4th, reaching a high of $4753.30/oz on May 7th. However, it should be noted that geopolitical tensions may still fluctuate, and previously, when the conflict escalated, gold prices did not rise in tandem; instead, they were pressured by soaring oil prices, which exacerbated inflation stickiness and forced the Federal Reserve to maintain high interest rates. This indicates that geopolitical factors have limited support for gold.
At the Federal Reserve policy level, the latest developments show significant divergence, becoming a key influencing variable. On April 29, the Fed maintained the federal funds rate at 3.50%-3.75%, but the internal division within the Federal Open Market Committee (FOMC) was the largest since 1992. Of the 12 members, 8 supported maintaining the rate, 1 advocated a 25 basis point cut, and 3 opposed an easing stance. Currently, global investment banks have divergent expectations for the Fed's policy path in 2026. Some predict a 50 basis point rate cut this year, while others believe there will be no cut, and some institutions even predict a rate hike in the first half of 2027. This divergence has caused market volatility in the pricing of the dollar and gold, making it difficult to establish a clear trend in the short term.
Regarding US Treasury yields, the recent slight decline has somewhat eased the pressure on gold but it remains resilient. On May 7th, the yield on the 10-year US Treasury note fell 14 basis points to 4.337% intraday, reducing the opportunity cost of holding gold to some extent and providing weak support for a rebound. However, overall, the US 10-year real yield is still approaching the high interest rate threshold of 2%, and the neutral-to-high yield level has long limited the upward momentum of gold. If the yield rebounds to test the recent resistance level of 1.98%, it will still put downward pressure on gold prices.
Furthermore, global central bank actions and market demand exhibited divergent characteristics. Most major central banks maintained their interest rates unchanged, while the European Central Bank remained divided on rate hikes. The Reserve Bank of Australia raised rates for the third consecutive time by 25 basis points to 4.35%, and the Bank of Japan raised its inflation forecast. This policy divergence exacerbated global liquidity uncertainty. On the consumption side, the domestic gold market was sluggish. During the May Day holiday, the price of branded gold jewelry generally fell below 1400 yuan/gram, but the "buy high, sell low" mentality prevented a significant release of demand. On the investment side, there was divergence: medium- to long-term allocation funds viewed pullbacks as opportunities to buy, while short-term funds focused on fluctuations in core pricing variables, resulting in an overall cautious market sentiment.
Specifically, on Wednesday, May 6th, amid easing geopolitical tensions between the US and Iran, international spot gold rose nearly 3% in a single day. It is understood that a peace agreement is expected to be reached in the two-month-long US-Iran conflict, and this expectation has become the core driver of the gold price increase. From a market perspective, the end of the US-Iran conflict will reduce the risk of global stagflation, leading to a decline in oil prices and easing inflationary pressures. This will provide the Federal Reserve with room to adjust its policies. If the Fed turns dovish, it will weaken the attractiveness of the dollar, push down the dollar index, and thus improve the cost-effectiveness of gold, theoretically benefiting gold prices.
However, from a longer-term perspective, the gold rebound has not changed the overall weak trend. Between February 27, 2026 (the pre-war benchmark date) and May 6, the London Bullion Market Association (LMBA) spot gold fell by 9.9% cumulatively, significantly underperforming other core assets, confirming that although short-term geopolitical factors have driven a rebound, gold has not yet escaped its medium-term weakness.
Further analysis from a technical and cross-market perspective reveals that even after the significant 3% rebound on May 6th, gold (XAU/USD) has not yet entered a medium-term upward phase. The short-term rebound is more like a phase correction within a weak market, rather than a trend reversal.
Technical Analysis: After testing the 20-day moving average, the bullish momentum has significantly weakened.
(Spot gold daily chart source: EasyForex)
From a short-term perspective, since gold entered a range-bound trading pattern from April 17th to April 19th, 2026, the overall trend has been bearish. $4775/oz serves as a key short-term resistance level, and whether it is broken or not will directly determine whether the short-term bearish trend can continue. Current support levels for gold are mainly concentrated at $4645/oz, $4580/oz, and the $4524-$4486/oz support zone. Subsequent resistance levels point to the $4860-$4900/oz range, which corresponds to the previous high from April 15th to April 17th and is a significant resistance area for any short-term rebound.
Key factors supporting a short-term bearish outlook for gold
Based on comprehensive technical indicators, three core factors support a short-term bearish view on gold, confirming that the rebound is unlikely to be sustained:
Firstly, the rebound encountered resistance at key moving averages. Gold's recent rebound from the May 5th low stalled near the downward-sloping 20-day and 50-day moving averages. These two moving averages, important references for short-term trends, are currently trending downwards, forming strong resistance, meaning the short-term rebound momentum is insufficient to break through this resistance.
Secondly, it's approaching a key Fibonacci retracement level. This rebound has nearly reached the 61.8% Fibonacci retracement level of the previous decline—the range from the April 17 high to the May 5 low, corresponding to approximately $4740 per ounce. From a technical perspective, the 61.8% retracement level is crucial in distinguishing between a correction and a reversal. If it fails to break through effectively, the rebound may end, and gold prices will likely return to a downward trend.
Third, the RSI indicator shows a bearish divergence. The hourly Relative Strength Index (RSI) has fallen back from the overbought zone (above 70), and there was a clear bearish divergence previously – gold prices rebounded, but the RSI did not reach a new high in tandem and instead gradually declined. This means that the bullish momentum is rapidly weakening, and selling pressure may be coming soon, which is an important warning sign of short-term downward pressure.
Overall, although the easing of geopolitical tensions between the US and Iran has driven a temporary rebound in gold prices, core factors such as technical resistance and high real yields remain unchanged, and the short-term bearish trend remains intact. Going forward, key attention should be paid to whether the key resistance level of $4775/oz is broken, as well as the trend of the US 10-year real yield. If the resistance level is not broken and yields continue to rise, gold will likely return to its downward trend to test lower support levels. If the resistance is unexpectedly broken, a short-term correction should be anticipated.
At 19:10 Beijing time, spot gold was trading at $4,733.02 per ounce, up 0.90%.
- Risk Warning and Disclaimer
- The market involves risk, and trading may not be suitable for all investors. This article is for reference only and does not constitute personal investment advice, nor does it take into account certain users’ specific investment objectives, financial situation, or other needs. Any investment decisions made based on this information are at your own risk.