Silver: Structural Shortages and Market Strategies Amid a Weakening Dollar
2026-05-08 19:04:49
On Friday (May 8), silver ushered in a new round of price increases, with the price continuing its bullish momentum, reaching $80.593 per ounce during the session, a single-day increase of 2.66%.
The core driver of this round of price increases came from the weakening of the US dollar index. Despite renewed clashes between the US and Iran near the Strait of Hormuz, overall market risk aversion did not spiral out of control. Iran accused the US of attacking oil tankers and civilian facilities, while the US claimed its naval forces were attacked by missiles and drones; however, US President Trump reassured the market on Thursday, stating that the ceasefire agreement remained in effect, which alleviated some of the geopolitical panic. The weaker dollar provided significant support for precious metals, including silver. The declining dollar index made dollar-denominated commodities more attractive to international investors, thereby boosting demand for silver.
The market's focus has now shifted to the US April non-farm payrolls report, due Friday night. Economists expect US non-farm payrolls to increase by 62,000 in April, significantly lower than March's 178,000; the unemployment rate is expected to remain unchanged at 4.3%, while average hourly earnings are expected to rise year-on-year from 3.5% to 3.8%. Investors are closely watching the report for new clues about the direction of the Federal Reserve's monetary policy—the strength of the employment data will directly affect market expectations for the timing of interest rate cuts, and thus influence the subsequent trends of the US dollar and precious metals.
The structural supply-demand shortage in the silver market has persisted for the sixth consecutive year. According to the latest market forecast data from the International Silver Institute, the supply-demand gap in the silver market is expected to widen to 67 million ounces in 2026, exacerbating the imbalance and forcing the market to rely solely on accumulated inventory reserves to compensate for the supply shortage. However, current overall demand for silver is showing a divergent pattern, with uneven demand across different sectors.
Industrial demand for silver continues to decline, with the photovoltaic industry being the core factor dragging down industrial demand. Affected by high silver prices, major solar panel manufacturers are actively optimizing their production processes to continuously reduce the amount of silver used per photovoltaic cell, thereby controlling production costs. Amidst persistently weak industrial demand, investment demand for silver has shown remarkable resilience: global exchange-traded silver holdings have climbed to approximately 1.31 billion ounces; stimulated by the widening gap between physical silver supply and demand, London silver lending rates have surged to historic highs.
Technical Analysis
From the daily chart, the spot silver price movement shows a clear two-stage structure: first, a strong main upward wave from November 2025 to January 2026, relying on the upward trend line, reaching a high of $121.487/ounce; after peaking, the price quickly fell back, breaking the trend line and hitting a low of $60.964 in February 2026. Subsequently, it entered a wide range of high-level fluctuations with $61 as the lower limit and $96 as the upper limit. Recently, the silver price has broken upwards due to the weakening of the US dollar and is currently trading around $80.85, but has not yet broken out of this fluctuation pattern.
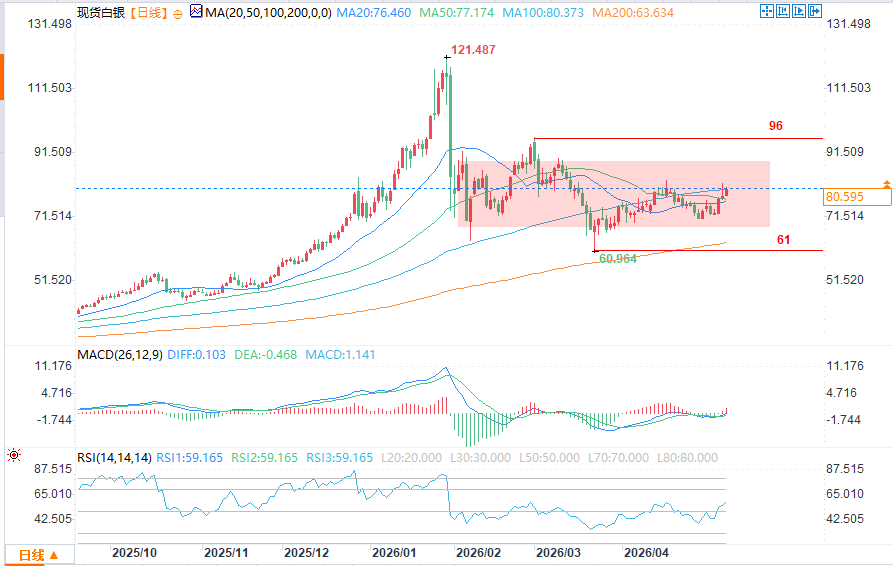
(Spot silver daily chart source: EasyTrade)
From a key support and resistance perspective, the current price is within the core range of $68.300–$89.000 of the horizontal volume distribution, and is precisely near the point of control (POC) of $79.100–$81.000, making it a crucial battleground for short-term bullish and bearish forces. The primary resistance level is the previous rebound high near $96, which is also the upper edge of the entire trading range. On the downside, strong support lies near the February low of $61, further reinforced by the long-term support of the 200-day moving average ($63.635), forming a double protective barrier.
Regarding the moving average system, the 20-day moving average (MA20) (76.465) and the 50-day moving average (MA50) are currently flat, with the price trading above both short-term moving averages. This indicates that the short-term trend has shifted from a downtrend to a slightly bullish consolidation, and the bullish momentum has recovered somewhat. The price has just risen above the 100-day moving average (MA100) (80.374), and whether it can hold above this level is a key signal for judging the short-term strength or weakness. Meanwhile, the 200-day moving average (MA200) remains upward, indicating that the long-term uptrend has not been broken, and the long-term support below remains solid. The overall moving averages have shifted from a bearish alignment to a flat and intertwined pattern, reflecting that the market is in a consolidation phase where bulls and bears are in equilibrium.
In terms of technical indicators, the MACD indicator shows that the downward momentum has obviously exhausted and the short-term bullish momentum has begun to be released, showing a recovery signal after the golden cross, but it has not yet formed a trend of large volume increase; the RSI (14) reading is 59, which is in the neutral to strong range. It is neither overbought nor oversold, which is highly consistent with the current oscillating market. There is no clear unilateral trend signal yet.
Summarize
The current silver market is dominated by multiple forces: on the one hand, there is a structural supply shortage caused by investment demand; on the other hand, there is the pressure of weakening industrial consumption due to shrinking demand in the photovoltaic industry; at the same time, the short-term positive impact of a weaker dollar and the uncertainty of the Middle East geopolitical situation are intertwined, coupled with the policy expectation changes brought about by the upcoming non-farm payroll report, making the market's bull-bear game more complex.
From a technical perspective, although silver prices rebounded in the short term due to a weakening dollar, they remain trapped in a wide-range fluctuation at high levels, and the direction is still unclear. Two key points need to be observed going forward: first, whether silver can hold above the 100-day moving average (MA100) and break through the upper edge of the high-volume trading zone at $89; a successful breakout could open up upward potential to test the $96 resistance level; second, whether silver can hold above the 20-day and 50-day moving averages (MA20/MA50) ($76-77) and the lower edge of the high-volume trading zone at $68.30; a break below this level would likely lead to a second test of the strong support at $61.
Overall, the non-farm payroll report will be a key catalyst for short-term market movements. A significantly weaker-than-expected report could further depress the dollar and boost silver prices; conversely, a stronger-than-expected report could trigger a dollar rebound and suppress precious metal prices. The outcome and shifts in the dynamics of this interplay between these two opposing factors will likely determine the future direction and volatility of the silver market.
The core driver of this round of price increases came from the weakening of the US dollar index. Despite renewed clashes between the US and Iran near the Strait of Hormuz, overall market risk aversion did not spiral out of control. Iran accused the US of attacking oil tankers and civilian facilities, while the US claimed its naval forces were attacked by missiles and drones; however, US President Trump reassured the market on Thursday, stating that the ceasefire agreement remained in effect, which alleviated some of the geopolitical panic. The weaker dollar provided significant support for precious metals, including silver. The declining dollar index made dollar-denominated commodities more attractive to international investors, thereby boosting demand for silver.
The market's focus has now shifted to the US April non-farm payrolls report, due Friday night. Economists expect US non-farm payrolls to increase by 62,000 in April, significantly lower than March's 178,000; the unemployment rate is expected to remain unchanged at 4.3%, while average hourly earnings are expected to rise year-on-year from 3.5% to 3.8%. Investors are closely watching the report for new clues about the direction of the Federal Reserve's monetary policy—the strength of the employment data will directly affect market expectations for the timing of interest rate cuts, and thus influence the subsequent trends of the US dollar and precious metals.
The structural supply-demand shortage in the silver market has persisted for the sixth consecutive year. According to the latest market forecast data from the International Silver Institute, the supply-demand gap in the silver market is expected to widen to 67 million ounces in 2026, exacerbating the imbalance and forcing the market to rely solely on accumulated inventory reserves to compensate for the supply shortage. However, current overall demand for silver is showing a divergent pattern, with uneven demand across different sectors.
Industrial demand for silver continues to decline, with the photovoltaic industry being the core factor dragging down industrial demand. Affected by high silver prices, major solar panel manufacturers are actively optimizing their production processes to continuously reduce the amount of silver used per photovoltaic cell, thereby controlling production costs. Amidst persistently weak industrial demand, investment demand for silver has shown remarkable resilience: global exchange-traded silver holdings have climbed to approximately 1.31 billion ounces; stimulated by the widening gap between physical silver supply and demand, London silver lending rates have surged to historic highs.
Technical Analysis
From the daily chart, the spot silver price movement shows a clear two-stage structure: first, a strong main upward wave from November 2025 to January 2026, relying on the upward trend line, reaching a high of $121.487/ounce; after peaking, the price quickly fell back, breaking the trend line and hitting a low of $60.964 in February 2026. Subsequently, it entered a wide range of high-level fluctuations with $61 as the lower limit and $96 as the upper limit. Recently, the silver price has broken upwards due to the weakening of the US dollar and is currently trading around $80.85, but has not yet broken out of this fluctuation pattern.
(Spot silver daily chart source: EasyTrade)
From a key support and resistance perspective, the current price is within the core range of $68.300–$89.000 of the horizontal volume distribution, and is precisely near the point of control (POC) of $79.100–$81.000, making it a crucial battleground for short-term bullish and bearish forces. The primary resistance level is the previous rebound high near $96, which is also the upper edge of the entire trading range. On the downside, strong support lies near the February low of $61, further reinforced by the long-term support of the 200-day moving average ($63.635), forming a double protective barrier.
Regarding the moving average system, the 20-day moving average (MA20) (76.465) and the 50-day moving average (MA50) are currently flat, with the price trading above both short-term moving averages. This indicates that the short-term trend has shifted from a downtrend to a slightly bullish consolidation, and the bullish momentum has recovered somewhat. The price has just risen above the 100-day moving average (MA100) (80.374), and whether it can hold above this level is a key signal for judging the short-term strength or weakness. Meanwhile, the 200-day moving average (MA200) remains upward, indicating that the long-term uptrend has not been broken, and the long-term support below remains solid. The overall moving averages have shifted from a bearish alignment to a flat and intertwined pattern, reflecting that the market is in a consolidation phase where bulls and bears are in equilibrium.
In terms of technical indicators, the MACD indicator shows that the downward momentum has obviously exhausted and the short-term bullish momentum has begun to be released, showing a recovery signal after the golden cross, but it has not yet formed a trend of large volume increase; the RSI (14) reading is 59, which is in the neutral to strong range. It is neither overbought nor oversold, which is highly consistent with the current oscillating market. There is no clear unilateral trend signal yet.
Summarize
The current silver market is dominated by multiple forces: on the one hand, there is a structural supply shortage caused by investment demand; on the other hand, there is the pressure of weakening industrial consumption due to shrinking demand in the photovoltaic industry; at the same time, the short-term positive impact of a weaker dollar and the uncertainty of the Middle East geopolitical situation are intertwined, coupled with the policy expectation changes brought about by the upcoming non-farm payroll report, making the market's bull-bear game more complex.
From a technical perspective, although silver prices rebounded in the short term due to a weakening dollar, they remain trapped in a wide-range fluctuation at high levels, and the direction is still unclear. Two key points need to be observed going forward: first, whether silver can hold above the 100-day moving average (MA100) and break through the upper edge of the high-volume trading zone at $89; a successful breakout could open up upward potential to test the $96 resistance level; second, whether silver can hold above the 20-day and 50-day moving averages (MA20/MA50) ($76-77) and the lower edge of the high-volume trading zone at $68.30; a break below this level would likely lead to a second test of the strong support at $61.
Overall, the non-farm payroll report will be a key catalyst for short-term market movements. A significantly weaker-than-expected report could further depress the dollar and boost silver prices; conversely, a stronger-than-expected report could trigger a dollar rebound and suppress precious metal prices. The outcome and shifts in the dynamics of this interplay between these two opposing factors will likely determine the future direction and volatility of the silver market.
- Risk Warning and Disclaimer
- The market involves risk, and trading may not be suitable for all investors. This article is for reference only and does not constitute personal investment advice, nor does it take into account certain users’ specific investment objectives, financial situation, or other needs. Any investment decisions made based on this information are at your own risk.