The Mystery of the Dollar's Movement: In-depth Analysis of the "Structural Cracks" in US Economic Data
2026-05-11 16:24:49
On Monday (May 11), the US dollar index rose and then fell back, and is currently trading around 97.97.
Recently, US macroeconomic data has presented an extremely polarized picture: on the one hand, US stock indices have frequently hit new highs, while employment data appears to be robust.
On the other hand, consumer confidence has plummeted, with a huge gap between people's actual experience and macroeconomic reports.
This logical conflict between the data reveals the profound changes taking place in the US economy under the impact of inflation and geopolitical shocks.
The following is an in-depth analysis of the key contradictions in recent US economic data:

The most significant contradiction at present lies in the inconsistency between what the public "says" and what they "do".
Conflicting data: The University of Michigan's consumer confidence index for March and April was 49.8 and 48.2 respectively, marking the lowest level in 74 years.
However, retail revenue in March increased by 4% year-on-year, indicating that consumer spending remains strong.
Analysis: This contradiction is known as "emotional recession." On the one hand, partisan politics interfered with the survey results (the public tends to express political dissatisfaction through surveys).
On the other hand, despite the physical pain, high-income groups maintained the growth of total consumption, masking the contraction of the lower classes.
Traditional economics holds that low unemployment (good employment) leads to wage increases, which in turn pushes up inflation.
However, the current data shows a discrepancy:
Paradoxical situation: The low unemployment rate of 4.3% means that the labor market remains tight, but inflation expectations in May (4.5%) are declining, and wage growth (3.6%) is even lagging behind price increases.
Underlying Factors: The Hedging Effect of Globalization and Automation: Although the US domestic employment situation is good, the repair of the global supply chain and the application of technologies such as AI may have lowered the cost of goods.
Loss of bargaining power in the labor market: Although there are many jobs, they are mostly concentrated in low-wage sectors such as the service industry. Workers lack the ability to demand higher wages to cover inflation. This explains why "good employment" has not translated into a vicious cycle of "wages-prices," but instead has led to a squeeze on people's livelihoods.
If the struggle for survival is a pain at the individual level, then the logical consistency of the macro-financial system is an even greater contradiction.
Where did the "water" flow? On the macro level: the S&P 500 index surged to 7,400 points, reflecting that liquidity in the financial system remains extremely abundant, and the capital market believes that the economy is "incredibly good."
At the micro level: the soaring credit card default rate and the scale of consumer loans reflect that liquidity in the real economy is drying up.
The core conflict lies in the complete failure of monetary policy transmission. High interest rates were originally intended to tighten liquidity, but the result was only to tighten the "poor man's wallet." Instead, the assets held by the rich continued to expand due to profit expectations (such as the AI wave) and scarcity.
The polarization of economic data outlines the starkly different living conditions between social classes.
Conflicting data: The S&P 500 index has surpassed 7,400 points for the first time, and the wealth of the affluent continues to expand; at the same time, the scale of personal consumer loans and credit card overdrafts continues to rise.
Analysis: Families with an annual income of over $150,000 are still booking summer vacations as usual, and even Disney bookings for the second half of 2026 remain strong. Meanwhile, the low- and middle-income groups, who make up 50% of the population, are already caught in a "survival squeeze." Low-income earners are forced to cut spending and give up vacations. Their monthly salaries are no longer enough to cover their basic living expenses, and they have to rely on high-interest debt to make ends meet.
Employment data is currently the last bastion of market confidence, but its internal structure has shown cracks.
Conflicting data: The unemployment rate remained stable at 4.3% in April, with 115,000 new non-farm jobs created, but at the same time, the share of labor income in GDP fell to a record low.
Analysis: Analysts such as Allianz Group warn that the lead of capital gains (stocks, assets) over labor income continues to widen. While job opportunities are increasing, the resilience of lower-income workers has reached a critical point.
The current prosperity of the US economy is essentially a structural and fragmented false prosperity. The impressive stock market, employment and total consumption at the macro level are sharply divided by the low public confidence, shrinking real wages and high debt at the micro level.
When the asset inflation of high-net-worth individuals can no longer offset the survival pressure on the lower classes, the resilience of consumption supported by debt will face severe challenges.
The “impressive” macroeconomic data may only be temporary. The surge in credit card debt and the negative growth in real wages have already sounded the alarm for the risk of a future recession.
From a technical perspective, the current trend of the US dollar index is rather unfavorable, with the overall downward-trending moving averages putting significant pressure on the index.
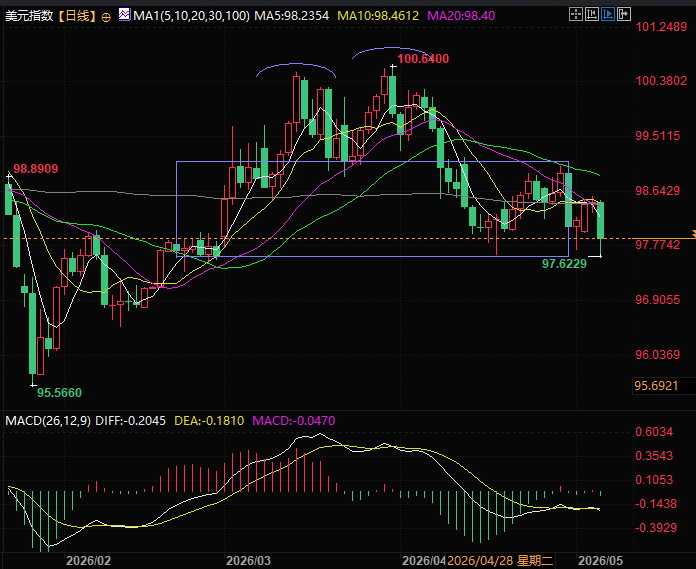
(US Dollar Index Daily Chart, Source: EasyForex)
At 16:22 Beijing time, the US dollar index is currently at 97.91.
Recently, US macroeconomic data has presented an extremely polarized picture: on the one hand, US stock indices have frequently hit new highs, while employment data appears to be robust.
On the other hand, consumer confidence has plummeted, with a huge gap between people's actual experience and macroeconomic reports.
This logical conflict between the data reveals the profound changes taking place in the US economy under the impact of inflation and geopolitical shocks.
The following is an in-depth analysis of the key contradictions in recent US economic data:
The Discrepancy Between Confidence and Behavior: Emotional Decline vs. Spending Resilience
The most significant contradiction at present lies in the inconsistency between what the public "says" and what they "do".
Conflicting data: The University of Michigan's consumer confidence index for March and April was 49.8 and 48.2 respectively, marking the lowest level in 74 years.
However, retail revenue in March increased by 4% year-on-year, indicating that consumer spending remains strong.
Analysis: This contradiction is known as "emotional recession." On the one hand, partisan politics interfered with the survey results (the public tends to express political dissatisfaction through surveys).
On the other hand, despite the physical pain, high-income groups maintained the growth of total consumption, masking the contraction of the lower classes.
Why did high employment not lead to high inflation? Is the Phillips curve failing?
Traditional economics holds that low unemployment (good employment) leads to wage increases, which in turn pushes up inflation.
However, the current data shows a discrepancy:
Paradoxical situation: The low unemployment rate of 4.3% means that the labor market remains tight, but inflation expectations in May (4.5%) are declining, and wage growth (3.6%) is even lagging behind price increases.
Underlying Factors: The Hedging Effect of Globalization and Automation: Although the US domestic employment situation is good, the repair of the global supply chain and the application of technologies such as AI may have lowered the cost of goods.
Loss of bargaining power in the labor market: Although there are many jobs, they are mostly concentrated in low-wage sectors such as the service industry. Workers lack the ability to demand higher wages to cover inflation. This explains why "good employment" has not translated into a vicious cycle of "wages-prices," but instead has led to a squeeze on people's livelihoods.
A contradiction "greater" than the pressure to survive: macro liquidity versus microeconomic depletion.
If the struggle for survival is a pain at the individual level, then the logical consistency of the macro-financial system is an even greater contradiction.
Where did the "water" flow? On the macro level: the S&P 500 index surged to 7,400 points, reflecting that liquidity in the financial system remains extremely abundant, and the capital market believes that the economy is "incredibly good."
At the micro level: the soaring credit card default rate and the scale of consumer loans reflect that liquidity in the real economy is drying up.
The core conflict lies in the complete failure of monetary policy transmission. High interest rates were originally intended to tighten liquidity, but the result was only to tighten the "poor man's wallet." Instead, the assets held by the rich continued to expand due to profit expectations (such as the AI wave) and scarcity.
The widening divergence of K-lines: Stock market boom vs. soaring debt.
The polarization of economic data outlines the starkly different living conditions between social classes.
Conflicting data: The S&P 500 index has surpassed 7,400 points for the first time, and the wealth of the affluent continues to expand; at the same time, the scale of personal consumer loans and credit card overdrafts continues to rise.
Analysis: Families with an annual income of over $150,000 are still booking summer vacations as usual, and even Disney bookings for the second half of 2026 remain strong. Meanwhile, the low- and middle-income groups, who make up 50% of the population, are already caught in a "survival squeeze." Low-income earners are forced to cut spending and give up vacations. Their monthly salaries are no longer enough to cover their basic living expenses, and they have to rely on high-interest debt to make ends meet.
Lagging Statistical Data: Stable Employment vs. Risk Warnings
Employment data is currently the last bastion of market confidence, but its internal structure has shown cracks.
Conflicting data: The unemployment rate remained stable at 4.3% in April, with 115,000 new non-farm jobs created, but at the same time, the share of labor income in GDP fell to a record low.
Analysis: Analysts such as Allianz Group warn that the lead of capital gains (stocks, assets) over labor income continues to widen. While job opportunities are increasing, the resilience of lower-income workers has reached a critical point.
In conclusion: Cracks have already appeared.
The current prosperity of the US economy is essentially a structural and fragmented false prosperity. The impressive stock market, employment and total consumption at the macro level are sharply divided by the low public confidence, shrinking real wages and high debt at the micro level.
When the asset inflation of high-net-worth individuals can no longer offset the survival pressure on the lower classes, the resilience of consumption supported by debt will face severe challenges.
The “impressive” macroeconomic data may only be temporary. The surge in credit card debt and the negative growth in real wages have already sounded the alarm for the risk of a future recession.
From a technical perspective, the current trend of the US dollar index is rather unfavorable, with the overall downward-trending moving averages putting significant pressure on the index.
(US Dollar Index Daily Chart, Source: EasyForex)
At 16:22 Beijing time, the US dollar index is currently at 97.91.
- Risk Warning and Disclaimer
- The market involves risk, and trading may not be suitable for all investors. This article is for reference only and does not constitute personal investment advice, nor does it take into account certain users’ specific investment objectives, financial situation, or other needs. Any investment decisions made based on this information are at your own risk.