Behind the 1% drop in gold prices: a double whammy of inflation and high interest rates, with the next target pointing to $4,500?
2026-05-11 17:58:22
On Monday, May 11, spot gold retreated, currently down about 1% to $4,660 per ounce, while US gold futures for June delivery fell 1.1% to $4,677.80 per ounce. Brent crude oil prices, however, rose above $104 per barrel, gaining over 3.5%, mainly due to the stalemate in US-Iran peace talks and continued disruptions to shipping in the Strait of Hormuz. High oil prices are pushing up inflation expectations, coupled with a stabilizing and strengthening US dollar, putting pressure on non-yielding assets like gold. Spot gold has recently been trading in a narrow range between $4,650 and $4,690 per ounce, having fallen more than 11% from its pre-conflict high in late February. Market focus has quickly shifted to the upcoming April US Consumer Price Index data and related geopolitical developments.
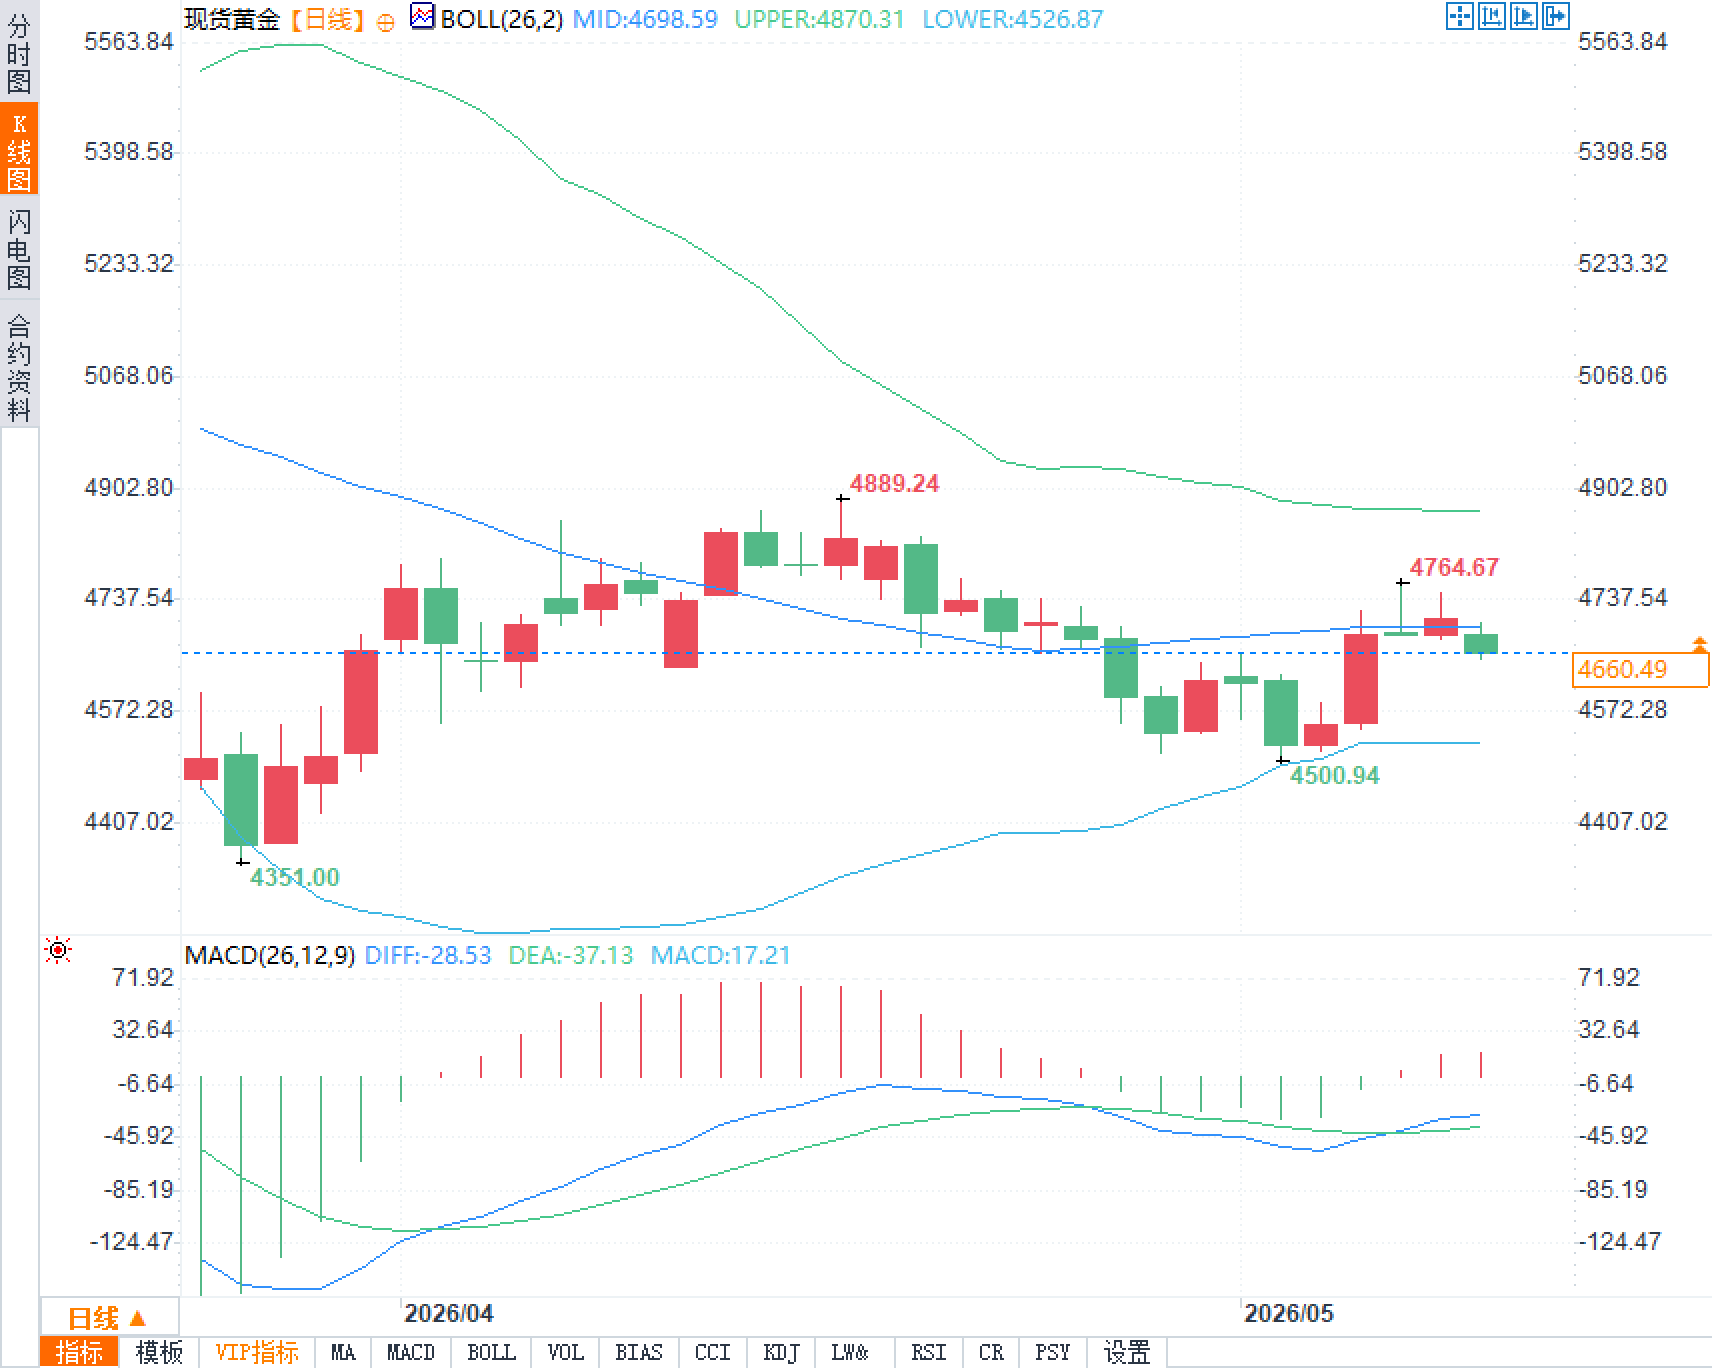
The daily chart for spot gold shows that the price has currently fallen to near the middle Bollinger Band (26,2), which is located at $4698.59/oz, with the upper band at $4870.31/oz and the lower band at $4526.87/oz. Recent candlestick patterns show a high-level consolidation. The MACD indicator (26,12,9) shows a DIFF value of -28.53 and a DEA value of -37.13, with the MACD line below the zero line, indicating that short-term momentum remains weak. Traders are focusing on the support level of $4650/oz. If this level is broken, it may further test the lows near $4500/oz; conversely, if oil prices fall or there are positive signals in negotiations, gold prices are expected to rebound and test the $4750/oz level. Technically, the short-term negative correlation between gold and crude oil has become more prominent again, with high oil prices suppressing gold's safe-haven appeal through inflation transmission.
The latest developments in the US-Iran peace talks have become a core driver of the market. US President Trump explicitly rejected Iran's response to the peace proposal last Sunday, calling it "completely unacceptable." Iran, on the other hand, insists on ending the full-scale conflict, lifting the naval blockade, resuming oil exports, and receiving war reparations. The significant difference in positions between the two sides has led to continued disruptions to shipping in the Strait of Hormuz. This strait previously handled about one-fifth of the world's oil and liquefied natural gas transport; currently, only a few oil tankers are passing through with their trackers off, and supply chain tensions are pushing up crude oil premiums. Market analysts point out that the conflict has lasted for ten weeks, and the inflationary effect of a roughly $10 increase per barrel in oil prices will significantly increase the probability of the Federal Reserve maintaining high interest rates, thus exerting sustained downward pressure on gold. Traders are closely monitoring subsequent diplomatic and military developments. If the stalemate continues, the downside risk for gold prices will further amplify; conversely, if there are substantial signs of easing tensions, gold may quickly recover some of its losses.
High oil prices have directly pushed up global inflation expectations. The US Consumer Price Index (CPI) rose 3.3% year-on-year in March, with core inflation also increasing, and the market has largely ruled out the possibility of a Federal Reserve rate cut in 2026. According to the CME FedWatch tool, the probability of a rate hike before March 2027 is approximately 31%. As a zero-interest asset, gold's attractiveness diminishes in a high-interest-rate environment due to increased holding costs. Traders are focused on tomorrow's release of the April US CPI data; if the data is higher than expected, it will further strengthen high-interest-rate expectations, putting additional downward pressure on gold prices. At the same time, a stronger US dollar index also increases the cost of holding dollar-denominated gold for holders of other currencies, exacerbating selling pressure. Overall, the dual squeeze of inflation and interest rates is the core fundamental logic behind the current pressure on gold prices.
Latest spot gold market trends and technical characteristics
The daily chart for spot gold shows that the price has currently fallen to near the middle Bollinger Band (26,2), which is located at $4698.59/oz, with the upper band at $4870.31/oz and the lower band at $4526.87/oz. Recent candlestick patterns show a high-level consolidation. The MACD indicator (26,12,9) shows a DIFF value of -28.53 and a DEA value of -37.13, with the MACD line below the zero line, indicating that short-term momentum remains weak. Traders are focusing on the support level of $4650/oz. If this level is broken, it may further test the lows near $4500/oz; conversely, if oil prices fall or there are positive signals in negotiations, gold prices are expected to rebound and test the $4750/oz level. Technically, the short-term negative correlation between gold and crude oil has become more prominent again, with high oil prices suppressing gold's safe-haven appeal through inflation transmission.
The direct impact of geopolitical factors on gold prices
The latest developments in the US-Iran peace talks have become a core driver of the market. US President Trump explicitly rejected Iran's response to the peace proposal last Sunday, calling it "completely unacceptable." Iran, on the other hand, insists on ending the full-scale conflict, lifting the naval blockade, resuming oil exports, and receiving war reparations. The significant difference in positions between the two sides has led to continued disruptions to shipping in the Strait of Hormuz. This strait previously handled about one-fifth of the world's oil and liquefied natural gas transport; currently, only a few oil tankers are passing through with their trackers off, and supply chain tensions are pushing up crude oil premiums. Market analysts point out that the conflict has lasted for ten weeks, and the inflationary effect of a roughly $10 increase per barrel in oil prices will significantly increase the probability of the Federal Reserve maintaining high interest rates, thus exerting sustained downward pressure on gold. Traders are closely monitoring subsequent diplomatic and military developments. If the stalemate continues, the downside risk for gold prices will further amplify; conversely, if there are substantial signs of easing tensions, gold may quickly recover some of its losses.
Analysis of Inflationary Pressures and Monetary Policy Path
High oil prices have directly pushed up global inflation expectations. The US Consumer Price Index (CPI) rose 3.3% year-on-year in March, with core inflation also increasing, and the market has largely ruled out the possibility of a Federal Reserve rate cut in 2026. According to the CME FedWatch tool, the probability of a rate hike before March 2027 is approximately 31%. As a zero-interest asset, gold's attractiveness diminishes in a high-interest-rate environment due to increased holding costs. Traders are focused on tomorrow's release of the April US CPI data; if the data is higher than expected, it will further strengthen high-interest-rate expectations, putting additional downward pressure on gold prices. At the same time, a stronger US dollar index also increases the cost of holding dollar-denominated gold for holders of other currencies, exacerbating selling pressure. Overall, the dual squeeze of inflation and interest rates is the core fundamental logic behind the current pressure on gold prices.
Frequently Asked Questions
Question 1: What will be the long-term impact of the obstruction of the Strait of Hormuz on spot gold?
A: This strait is a vital global energy transport route. Prolonged obstruction will continuously push up crude oil prices and transmit this to global inflation, reinforcing the high-interest-rate environment. Gold may continue to face downward pressure in the short term, but if the conflict escalates or negotiations break down, safe-haven demand may reverse later, supporting a rebound in gold prices.
Question 2: How should traders interpret current technical signals?
A: The Bollinger Band middle line at $4698/oz forms a significant resistance level, while the lower line at $4526/oz is a potential support level. The MACD indicator remains below the zero line, indicating a continued bearish short-term trend. Traders should pay close attention to the $4650/oz level in conjunction with tomorrow's CPI data, as it will be a key reference for judging the next move.
- Risk Warning and Disclaimer
- The market involves risk, and trading may not be suitable for all investors. This article is for reference only and does not constitute personal investment advice, nor does it take into account certain users’ specific investment objectives, financial situation, or other needs. Any investment decisions made based on this information are at your own risk.