When the energy crisis meets the gold rush: the Indian rupee becomes the biggest loser.
2026-05-13 16:42:33
As the world's second-largest gold consumer market, India has raised import tariffs on gold and silver from 6% to 15%. This move comes a year after Prime Minister Modi called on the public to refrain from buying gold, aiming to curb the depreciation pressure on the rupee caused by overseas gold purchases. Meanwhile, the conflict with Iran has led to rising energy costs, further increasing India's import bill and causing the rupee to recently fall to a record low.

According to a government notice released on Wednesday (May 13), India will impose a 10% basic tariff and a 5% surcharge on gold and silver imports, totaling 15%. A World Gold Council report shows that India's average monthly gold imports will increase to 83 tons in the first two months of 2026, up from 53 tons in 2025. In the first quarter of 2026, India's gold demand is expected to nearly double year-on-year, reaching a record $25 billion. However, this strong demand has driven up import bills, and rising global energy prices and the situation in the Middle East have further exacerbated import pressures.
India is a net importer of goods, with a trade deficit exceeding $330 billion in the fiscal year ending March 2026, up from $280 billion the previous year. Gold and silver account for nearly 11% of India's total imports, while crude oil and petroleum products account for 22%. Vishrut Rana, an Asia-Pacific economist at S&P Global Ratings, stated that reducing gold imports would indeed help curb capital outflows, but energy costs remain the core issue; as long as energy prices remain high, pressure on the rupee will persist.
India relies on imports for nearly 85% of its fuel needs. Before the war, approximately 50% of its crude oil, 60% of its liquefied natural gas, and almost all of its liquefied petroleum gas were transported through the Strait of Hormuz. Rising energy costs are expected to significantly widen the trade deficit and current account deficit, and the rupee has recently fallen to a historic low against the dollar.
Trinh Nguyen, senior economist at Natixis, points out that India is "regressing" from market-oriented reforms—the very reason investors were initially bullish on the country. She states that instead of raising fuel retail prices to curb demand, India has chosen to increase import tariffs and deviate from the path of economic liberalization.
On Monday, Modi urged Indians to use public transport, work from home, and carpool to save fuel. India becomes the latest Asian country to encourage reduced fuel consumption as tensions in the Middle East drive up energy costs.
Overall, India's increase in gold import tariffs and calls for fuel conservation are essentially short-term emergency measures to address the rupee's depreciation and widening trade deficit. However, the structural predicament of heavy energy reliance on imports, coupled with a potential policy shift towards protectionism, could undermine investor confidence in India's market-oriented reforms. Against the backdrop of the ongoing conflict with Iran and high energy prices, the rupee still faces significant downward pressure in the short term.
Looking at the daily chart for USD/INR, the current exchange rate is trading around 95.70, remaining within an upward channel since February 2026. The continued rise in USD/IRR reflects the persistent depreciation pressure on the rupee. This technical trend is highly consistent with fundamental factors—recent increases in Indian gold import tariffs, rising energy import costs, and a widening trade deficit have all contributed to suppressing the rupee's exchange rate.
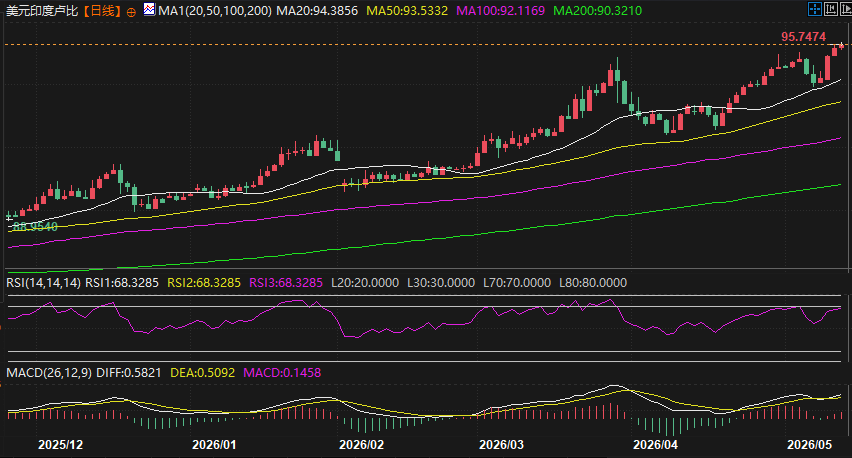
(USD/INR daily chart, source: FX678)
In terms of the moving average system, a textbook bullish pattern is presented. Specifically, the four moving averages—MA20 (94.39), MA50 (93.53), MA100 (92.12), and MA200 (90.32)—are arranged from bottom to top, with the short-term moving average at the top and the long-term moving average at the bottom. This is a typical bullish trend signal, indicating that the medium- to long-term upward trend of USD/RUB is solid. The current price of approximately 95.70 is higher than MA20 (94.38), MA50 (93.53), MA100 (92.12), and MA200 (90.32), indicating that it is in an upward trend.
As a major energy importer, India faces challenges from the Middle East conflict pushing up oil prices, a widening trade deficit, and persistent pressure on the rupee to depreciate. These fundamental factors, combined with technical indicators, create a synergistic effect. In the short term, the USD/RUB exchange rate may consolidate around the 20-day moving average (MA20) to digest overbought pressure. However, as long as it remains above the 50-day moving average (MA50), the upward trend will not be broken. Investors should pay attention to the recovery of the MA20 and the extent of any pullback after the RSI enters overbought territory to determine if a better opportunity to buy on dips is emerging.
At 15:53 Beijing time on May 13, the US dollar was trading at 95.71/72 against the Indian rupee.
Tariffs double, gold imports surge, raising concerns
According to a government notice released on Wednesday (May 13), India will impose a 10% basic tariff and a 5% surcharge on gold and silver imports, totaling 15%. A World Gold Council report shows that India's average monthly gold imports will increase to 83 tons in the first two months of 2026, up from 53 tons in 2025. In the first quarter of 2026, India's gold demand is expected to nearly double year-on-year, reaching a record $25 billion. However, this strong demand has driven up import bills, and rising global energy prices and the situation in the Middle East have further exacerbated import pressures.
The trade deficit widened, putting pressure on the rupee to a record low.
India is a net importer of goods, with a trade deficit exceeding $330 billion in the fiscal year ending March 2026, up from $280 billion the previous year. Gold and silver account for nearly 11% of India's total imports, while crude oil and petroleum products account for 22%. Vishrut Rana, an Asia-Pacific economist at S&P Global Ratings, stated that reducing gold imports would indeed help curb capital outflows, but energy costs remain the core issue; as long as energy prices remain high, pressure on the rupee will persist.
India relies on imports for nearly 85% of its fuel needs. Before the war, approximately 50% of its crude oil, 60% of its liquefied natural gas, and almost all of its liquefied petroleum gas were transported through the Strait of Hormuz. Rising energy costs are expected to significantly widen the trade deficit and current account deficit, and the rupee has recently fallen to a historic low against the dollar.
The policy shift has drawn attention, with Modi calling for fuel conservation.
Trinh Nguyen, senior economist at Natixis, points out that India is "regressing" from market-oriented reforms—the very reason investors were initially bullish on the country. She states that instead of raising fuel retail prices to curb demand, India has chosen to increase import tariffs and deviate from the path of economic liberalization.
On Monday, Modi urged Indians to use public transport, work from home, and carpool to save fuel. India becomes the latest Asian country to encourage reduced fuel consumption as tensions in the Middle East drive up energy costs.
Short-term measures are unlikely to solve structural problems, and the rupee's outlook remains under pressure.
Overall, India's increase in gold import tariffs and calls for fuel conservation are essentially short-term emergency measures to address the rupee's depreciation and widening trade deficit. However, the structural predicament of heavy energy reliance on imports, coupled with a potential policy shift towards protectionism, could undermine investor confidence in India's market-oriented reforms. Against the backdrop of the ongoing conflict with Iran and high energy prices, the rupee still faces significant downward pressure in the short term.
The rupee continues its depreciation trend.
Looking at the daily chart for USD/INR, the current exchange rate is trading around 95.70, remaining within an upward channel since February 2026. The continued rise in USD/IRR reflects the persistent depreciation pressure on the rupee. This technical trend is highly consistent with fundamental factors—recent increases in Indian gold import tariffs, rising energy import costs, and a widening trade deficit have all contributed to suppressing the rupee's exchange rate.
(USD/INR daily chart, source: FX678)
In terms of the moving average system, a textbook bullish pattern is presented. Specifically, the four moving averages—MA20 (94.39), MA50 (93.53), MA100 (92.12), and MA200 (90.32)—are arranged from bottom to top, with the short-term moving average at the top and the long-term moving average at the bottom. This is a typical bullish trend signal, indicating that the medium- to long-term upward trend of USD/RUB is solid. The current price of approximately 95.70 is higher than MA20 (94.38), MA50 (93.53), MA100 (92.12), and MA200 (90.32), indicating that it is in an upward trend.
As a major energy importer, India faces challenges from the Middle East conflict pushing up oil prices, a widening trade deficit, and persistent pressure on the rupee to depreciate. These fundamental factors, combined with technical indicators, create a synergistic effect. In the short term, the USD/RUB exchange rate may consolidate around the 20-day moving average (MA20) to digest overbought pressure. However, as long as it remains above the 50-day moving average (MA50), the upward trend will not be broken. Investors should pay attention to the recovery of the MA20 and the extent of any pullback after the RSI enters overbought territory to determine if a better opportunity to buy on dips is emerging.
At 15:53 Beijing time on May 13, the US dollar was trading at 95.71/72 against the Indian rupee.
- Risk Warning and Disclaimer
- The market involves risk, and trading may not be suitable for all investors. This article is for reference only and does not constitute personal investment advice, nor does it take into account certain users’ specific investment objectives, financial situation, or other needs. Any investment decisions made based on this information are at your own risk.