Gold prices weakened: Dollar and yields dampened upward momentum.
2026-05-14 01:02:31
On Wednesday (May 13), during the US session, gold maintained a slight downward trend and entered a consolidation phase. Currently, the US dollar is continuing its recovery, mainly due to the unresolved uncertainty surrounding US-Iran negotiations and rising market expectations that the Federal Reserve may maintain high interest rates for an extended period. These two factors have combined to strengthen the dollar, thus putting downward pressure on dollar-denominated gold. Spot gold was trading at $4697.08 per ounce, down nearly 0.38%, showing overall downward pressure.

Supply disruptions in the Middle East have triggered higher energy prices, an impact that continues to spill over into US inflation data. Data shows that the US Producer Price Index (PPI) rose 6.0% year-on-year in April, a significant acceleration from 4.3% in March and substantially higher than the market expectation of 4.9%. Meanwhile, the core PPI, excluding food and energy, climbed 5.2% year-on-year, up from 4.0% previously, also exceeding the market expectation of 4.3%, further highlighting the stickiness of US inflationary pressures.
This latest inflation data comes after Tuesday's Consumer Price Index (CPI) figures exceeded expectations. Tuesday's data showed that the U.S. overall CPI rose 3.8% year-on-year in April from 3.3% in March, higher than the market expectation of 3.7%, and also the highest level since May 2023. These two consecutive sets of better-than-expected inflation data have completely changed market expectations for the Federal Reserve's monetary policy.
The continued rise in inflation data has significantly reduced market expectations for a Federal Reserve rate cut this year, with traders increasingly believing that the next adjustment in the Fed's monetary policy might even be a rate hike. This expectation has directly driven up US Treasury yields, and gold, as a non-yielding asset, has become less attractive. On Wednesday, the yield on the benchmark 10-year US Treasury note climbed to around 4.48%, the highest level since July 2025, further pressuring gold prices.
According to the CME FedWatch Tool, traders generally expect the Federal Reserve to keep borrowing costs unchanged in the coming months, but by December, the probability of a Fed rate hike has risen to about 43%, and by January 2027, the probability is close to 54%. The expectation that high interest rates will be maintained for a longer period of time has become the market consensus.
In fact, since the outbreak of the Iraq War, the expectation of "high interest rates lasting longer" has been suppressing gold prices. Even though gold has the attributes of both an inflation hedge and a safe-haven asset, its attractiveness has continued to weaken under this expectation, making it difficult to play its traditional safe-haven and inflation-hedging functions.
In addition, a recent policy introduced by India has also attracted widespread attention in the gold market. India decided to significantly increase import tariffs on gold and silver from 6% to 15%. This move directly led to a sharp rise in domestic gold prices in India, and may also suppress physical gold demand in one of the world's largest gold consumers in the coming months, indirectly affecting international gold prices.
Geopolitically, the situation in the Middle East remains tense, with no signs of the war ending in the short term. Currently, peace talks between the US and Iran are stalled due to the Tehran nuclear program, and the Strait of Hormuz remains effectively closed. This ongoing geopolitical uncertainty should have supported safe-haven demand for gold, but its supporting role has been significantly weakened by expectations of high interest rates.
In addition, US President Trump plans to meet with Chinese President Xi Jinping later this week. On Tuesday, Trump told reporters that he did not need China's help to end the war with Iran, adding that the US would win the war "no matter what," a statement that has further drawn market attention to the geopolitical landscape.
Technical Analysis: The price is maintaining a range-bound movement around $4700, with weak momentum.
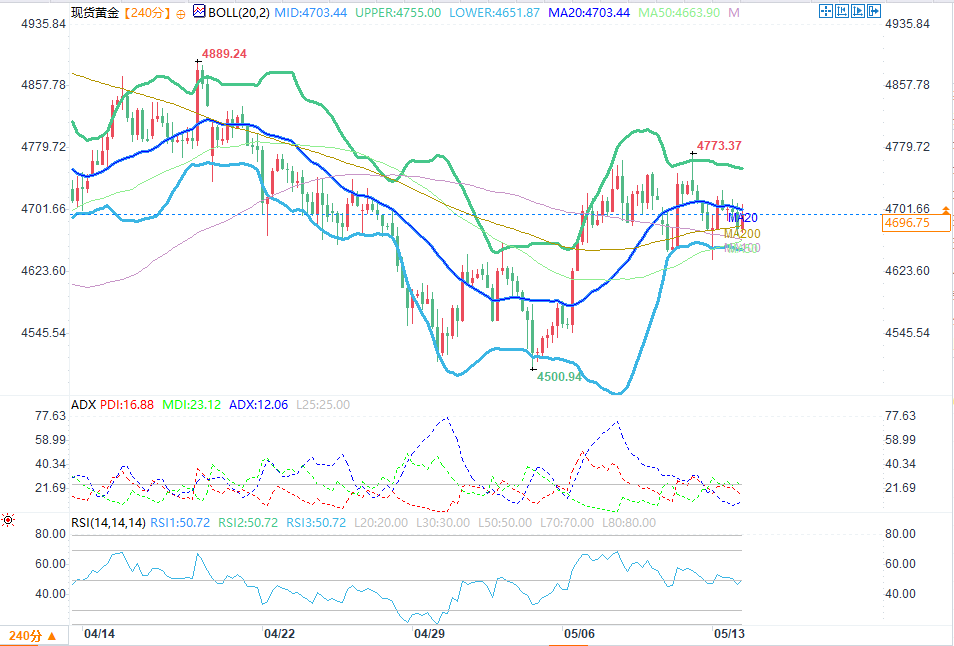
(4-hour chart of spot gold source: EasyForex)
From the 4-hour chart, gold is currently consolidating below the 20-period Bollinger Band Simple Moving Average (SMA), which is located around $4705/oz. The current price is $4697.08/oz, continuing to be pressured below this key moving average. After recently retreating from its highs, gold's short-term trend is neutral to slightly bearish. The price rose to $4726.77 during the day before encountering resistance and falling back, reaching a low of $4669.36. It is currently trading below the opening price of $4716.02, a slight decrease of $17.99 from yesterday's closing price of $4715.07, a drop of 0.38%, with a daily range of 1.22%, and no clear directional trend at present.
Bollinger Bands show that the price is currently hovering around the middle band of the Bollinger Band channel, without a clear breakout signal. Momentum indicators further confirm the current weak and volatile state: the Relative Strength Index (RSI) is around 51, in the neutral range, neither overbought nor oversold, indicating a temporary balance between bulls and bears, with neither side currently dominating. Meanwhile, the Average Directional Index (ADX) is only 12, at an extremely low level below 20, indicating very weak trend strength and a lack of clear directional momentum. This suggests that gold is currently in a typical range-bound trading pattern, with a decisive one-sided breakout unlikely in the short term.
On the upside, the initial resistance level is around $4,706/oz near the middle Bollinger Band, which coincides with the current pressure from the 20-period moving average. Further resistance is at the upper Bollinger Band around $4,753/oz, and above that, the horizontal resistance level of $4,850/oz will become a key medium-term resistance point.
On the downside, the lower Bollinger Band at around $4,657/oz will provide the first layer of support, close to the intraday low of $4,669.36/oz. If the price breaks below this support, the bearish momentum may be further released. If the bears regain control, strong potential buying is expected in the support zone around $4,500.00/oz, providing strong medium-term support for gold prices.
Supply disruptions in the Middle East have triggered higher energy prices, an impact that continues to spill over into US inflation data. Data shows that the US Producer Price Index (PPI) rose 6.0% year-on-year in April, a significant acceleration from 4.3% in March and substantially higher than the market expectation of 4.9%. Meanwhile, the core PPI, excluding food and energy, climbed 5.2% year-on-year, up from 4.0% previously, also exceeding the market expectation of 4.3%, further highlighting the stickiness of US inflationary pressures.
This latest inflation data comes after Tuesday's Consumer Price Index (CPI) figures exceeded expectations. Tuesday's data showed that the U.S. overall CPI rose 3.8% year-on-year in April from 3.3% in March, higher than the market expectation of 3.7%, and also the highest level since May 2023. These two consecutive sets of better-than-expected inflation data have completely changed market expectations for the Federal Reserve's monetary policy.
The continued rise in inflation data has significantly reduced market expectations for a Federal Reserve rate cut this year, with traders increasingly believing that the next adjustment in the Fed's monetary policy might even be a rate hike. This expectation has directly driven up US Treasury yields, and gold, as a non-yielding asset, has become less attractive. On Wednesday, the yield on the benchmark 10-year US Treasury note climbed to around 4.48%, the highest level since July 2025, further pressuring gold prices.
According to the CME FedWatch Tool, traders generally expect the Federal Reserve to keep borrowing costs unchanged in the coming months, but by December, the probability of a Fed rate hike has risen to about 43%, and by January 2027, the probability is close to 54%. The expectation that high interest rates will be maintained for a longer period of time has become the market consensus.
In fact, since the outbreak of the Iraq War, the expectation of "high interest rates lasting longer" has been suppressing gold prices. Even though gold has the attributes of both an inflation hedge and a safe-haven asset, its attractiveness has continued to weaken under this expectation, making it difficult to play its traditional safe-haven and inflation-hedging functions.
In addition, a recent policy introduced by India has also attracted widespread attention in the gold market. India decided to significantly increase import tariffs on gold and silver from 6% to 15%. This move directly led to a sharp rise in domestic gold prices in India, and may also suppress physical gold demand in one of the world's largest gold consumers in the coming months, indirectly affecting international gold prices.
Geopolitically, the situation in the Middle East remains tense, with no signs of the war ending in the short term. Currently, peace talks between the US and Iran are stalled due to the Tehran nuclear program, and the Strait of Hormuz remains effectively closed. This ongoing geopolitical uncertainty should have supported safe-haven demand for gold, but its supporting role has been significantly weakened by expectations of high interest rates.
In addition, US President Trump plans to meet with Chinese President Xi Jinping later this week. On Tuesday, Trump told reporters that he did not need China's help to end the war with Iran, adding that the US would win the war "no matter what," a statement that has further drawn market attention to the geopolitical landscape.
Technical Analysis: The price is maintaining a range-bound movement around $4700, with weak momentum.
(4-hour chart of spot gold source: EasyForex)
From the 4-hour chart, gold is currently consolidating below the 20-period Bollinger Band Simple Moving Average (SMA), which is located around $4705/oz. The current price is $4697.08/oz, continuing to be pressured below this key moving average. After recently retreating from its highs, gold's short-term trend is neutral to slightly bearish. The price rose to $4726.77 during the day before encountering resistance and falling back, reaching a low of $4669.36. It is currently trading below the opening price of $4716.02, a slight decrease of $17.99 from yesterday's closing price of $4715.07, a drop of 0.38%, with a daily range of 1.22%, and no clear directional trend at present.
Bollinger Bands show that the price is currently hovering around the middle band of the Bollinger Band channel, without a clear breakout signal. Momentum indicators further confirm the current weak and volatile state: the Relative Strength Index (RSI) is around 51, in the neutral range, neither overbought nor oversold, indicating a temporary balance between bulls and bears, with neither side currently dominating. Meanwhile, the Average Directional Index (ADX) is only 12, at an extremely low level below 20, indicating very weak trend strength and a lack of clear directional momentum. This suggests that gold is currently in a typical range-bound trading pattern, with a decisive one-sided breakout unlikely in the short term.
On the upside, the initial resistance level is around $4,706/oz near the middle Bollinger Band, which coincides with the current pressure from the 20-period moving average. Further resistance is at the upper Bollinger Band around $4,753/oz, and above that, the horizontal resistance level of $4,850/oz will become a key medium-term resistance point.
On the downside, the lower Bollinger Band at around $4,657/oz will provide the first layer of support, close to the intraday low of $4,669.36/oz. If the price breaks below this support, the bearish momentum may be further released. If the bears regain control, strong potential buying is expected in the support zone around $4,500.00/oz, providing strong medium-term support for gold prices.
- Risk Warning and Disclaimer
- The market involves risk, and trading may not be suitable for all investors. This article is for reference only and does not constitute personal investment advice, nor does it take into account certain users’ specific investment objectives, financial situation, or other needs. Any investment decisions made based on this information are at your own risk.