Why is the pound falling despite UK economic data hitting a one-year high?
2026-05-15 14:10:40
Following a sharp decline on Thursday, the pound continued its weakness against the dollar during the Asian session on Friday (May 15). As of 14:09, it hit a low of 1.3339, a new low since April 8, representing a drop of approximately 0.46%. So far this week, the pound has fallen by 2% against the dollar.
As domestic political turmoil in the UK continues to escalate, the pound has finally begun to react negatively. The previously strange divergence between the deteriorating UK political fundamentals and the pound's price resilience is rapidly correcting, while the dollar is breaking through resistance levels simultaneously, creating pressure from both factors.
Political turmoil in the UK continues to escalate. The resignation of former Health Secretary Wes Streatine on Thursday appears to have emboldened other potential challengers. Among the most threatening is the influential left-wing Mayor of Greater Manchester, Andy Burnham – widely seen as the biggest threat to Prime Minister Starmer's leadership. The resignation of a Labour MP from Greater Manchester paved the way for Burnham's return to Parliament, where he could potentially challenge for the premiership if successful. Markets are concerned that, against the backdrop of a deteriorating UK fiscal outlook and continued pressure on long-term government bonds, Burnham may push for more spending and tax increases.
What's special about the pound's reversal is that political turmoil is causing the market to overlook the actually good performance of the UK economy.
The Citi Economic Surprise Index shows that UK data has exceeded expectations to the highest degree since the second half of 2023. Thursday's stronger-than-expected GDP data further solidified this momentum – the economy grew by 0.6% quarter-on-quarter in the first quarter, far exceeding expectations, with positive contributions from the services, manufacturing, and construction sectors. While seasonal distortions and advance stockpiling related to the Iran conflict may have exaggerated the data, the report confirms that economic activity is much stronger than many feared. This suggests that the pressure on the pound stems more from concerns about political stability and fiscal credibility than from a sudden deterioration in economic fundamentals.
Adding insult to injury for the pound, the US economy remains strong. For most of the past year, US data has consistently exceeded expectations. Overnight, March retail sales figures were across the board – overall retail sales, excluding auto sales, and the closely watched control group all rose 0.5% month-over-month. The control group again exceeded expectations, indicating that household demand remains resilient despite rising fuel costs and high borrowing rates. Meanwhile, import prices surged 1.9% month-over-month, the largest increase in four years; excluding food and energy, they rose 0.7%, consistent with signals from earlier CPI and PPI data this week – inflationary pressures may be spreading through the US economy. Export prices also continued to exceed expectations, boosting US terms of trade at a time when many economies are squeezed by high imported energy costs. Combined with strong activity data, this reinforces the view that even with escalating geopolitical tensions, the Federal Reserve may need to maintain high interest rates for an extended period.
Based on the recent trend of the US dollar index, since hitting a low of 97.62 in early May, the index has been trending upwards for several consecutive trading days, with a cumulative increase of over 1.5% this week. On Friday, it broke through the 99 mark, reaching a new high since May. From a daily chart perspective, this round of gains exhibits typical rebound characteristics of "higher lows and higher highs," with gradually increasing candlestick bodies and significantly reduced volume on pullbacks, indicating active buying and weakening bearish momentum. On Friday, the US dollar index continued its upward trend, reaching a high of 99.13 by 13:15, a new high since April 13.
According to the GBP/USD daily chart, the current technical pattern clearly shows a bearish trend, with the price effectively breaking below all four moving averages, forming a typical bearish alignment. Specifically, the 20-day moving average (MA20) is at 1.3526, the 50-day moving average (MA50) is at 1.3429, the 100-day moving average (MA100) is at 1.3478, and the 200-day moving average (MA200) is at 1.3423. The current price is trading around 1.3353, significantly below all moving averages, and the fact that the MA50 has crossed below the MA100 further confirms the continuation of the downtrend.
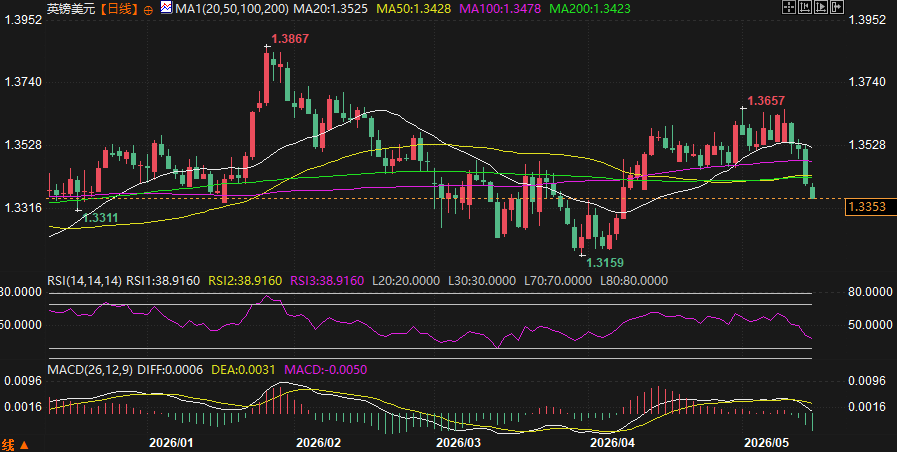
(GBP/USD daily chart, source: FX678)
Overall, political turmoil and fiscal concerns in the UK are outweighing better-than-expected economic data, while the continued US economic exceptionalism and the technical breakthrough of the US dollar index provide dual impetus for further declines in the exchange rate.
At 14:10 Beijing time on May 15, the British pound was trading at 1.3354/55 against the US dollar.
As domestic political turmoil in the UK continues to escalate, the pound has finally begun to react negatively. The previously strange divergence between the deteriorating UK political fundamentals and the pound's price resilience is rapidly correcting, while the dollar is breaking through resistance levels simultaneously, creating pressure from both factors.
Political turmoil has backfired, and Starmer's position is now in jeopardy.
Political turmoil in the UK continues to escalate. The resignation of former Health Secretary Wes Streatine on Thursday appears to have emboldened other potential challengers. Among the most threatening is the influential left-wing Mayor of Greater Manchester, Andy Burnham – widely seen as the biggest threat to Prime Minister Starmer's leadership. The resignation of a Labour MP from Greater Manchester paved the way for Burnham's return to Parliament, where he could potentially challenge for the premiership if successful. Markets are concerned that, against the backdrop of a deteriorating UK fiscal outlook and continued pressure on long-term government bonds, Burnham may push for more spending and tax increases.
Politics overrides economics, and impressive data is ignored.
What's special about the pound's reversal is that political turmoil is causing the market to overlook the actually good performance of the UK economy.
The Citi Economic Surprise Index shows that UK data has exceeded expectations to the highest degree since the second half of 2023. Thursday's stronger-than-expected GDP data further solidified this momentum – the economy grew by 0.6% quarter-on-quarter in the first quarter, far exceeding expectations, with positive contributions from the services, manufacturing, and construction sectors. While seasonal distortions and advance stockpiling related to the Iran conflict may have exaggerated the data, the report confirms that economic activity is much stronger than many feared. This suggests that the pressure on the pound stems more from concerns about political stability and fiscal credibility than from a sudden deterioration in economic fundamentals.
American exceptionalism persists, with data exceeding expectations across the board.
Adding insult to injury for the pound, the US economy remains strong. For most of the past year, US data has consistently exceeded expectations. Overnight, March retail sales figures were across the board – overall retail sales, excluding auto sales, and the closely watched control group all rose 0.5% month-over-month. The control group again exceeded expectations, indicating that household demand remains resilient despite rising fuel costs and high borrowing rates. Meanwhile, import prices surged 1.9% month-over-month, the largest increase in four years; excluding food and energy, they rose 0.7%, consistent with signals from earlier CPI and PPI data this week – inflationary pressures may be spreading through the US economy. Export prices also continued to exceed expectations, boosting US terms of trade at a time when many economies are squeezed by high imported energy costs. Combined with strong activity data, this reinforces the view that even with escalating geopolitical tensions, the Federal Reserve may need to maintain high interest rates for an extended period.
The US dollar index broke through, indicating a shift in technical indicators.
Based on the recent trend of the US dollar index, since hitting a low of 97.62 in early May, the index has been trending upwards for several consecutive trading days, with a cumulative increase of over 1.5% this week. On Friday, it broke through the 99 mark, reaching a new high since May. From a daily chart perspective, this round of gains exhibits typical rebound characteristics of "higher lows and higher highs," with gradually increasing candlestick bodies and significantly reduced volume on pullbacks, indicating active buying and weakening bearish momentum. On Friday, the US dollar index continued its upward trend, reaching a high of 99.13 by 13:15, a new high since April 13.
Bearish alignment, all moving averages breached
According to the GBP/USD daily chart, the current technical pattern clearly shows a bearish trend, with the price effectively breaking below all four moving averages, forming a typical bearish alignment. Specifically, the 20-day moving average (MA20) is at 1.3526, the 50-day moving average (MA50) is at 1.3429, the 100-day moving average (MA100) is at 1.3478, and the 200-day moving average (MA200) is at 1.3423. The current price is trading around 1.3353, significantly below all moving averages, and the fact that the MA50 has crossed below the MA100 further confirms the continuation of the downtrend.
(GBP/USD daily chart, source: FX678)
Overall, political turmoil and fiscal concerns in the UK are outweighing better-than-expected economic data, while the continued US economic exceptionalism and the technical breakthrough of the US dollar index provide dual impetus for further declines in the exchange rate.
At 14:10 Beijing time on May 15, the British pound was trading at 1.3354/55 against the US dollar.
- Risk Warning and Disclaimer
- The market involves risk, and trading may not be suitable for all investors. This article is for reference only and does not constitute personal investment advice, nor does it take into account certain users’ specific investment objectives, financial situation, or other needs. Any investment decisions made based on this information are at your own risk.