A stronger dollar and soaring yields triggered a sharp sell-off in gold.
2026-05-15 20:24:29
On Friday (May 15), during the European session, spot gold traded at $4,550.37 per ounce, reaching a high of $4,665.20 and a low of $4,531.99, with a daily fluctuation of over $130 and an intraday drop of approximately 2.19%.

The intraday price fluctuations reveal market sentiment: gold prices attempted to hold onto gains in the morning but subsequently encountered sharp selling pressure. Simultaneously, the US dollar index broke through the 99 mark, and the yield on the 10-year US Treasury note rose to 4.53%, nearing a one-year high. This combined negative impact of a stronger dollar and soaring US Treasury yields directly dragged down gold prices.
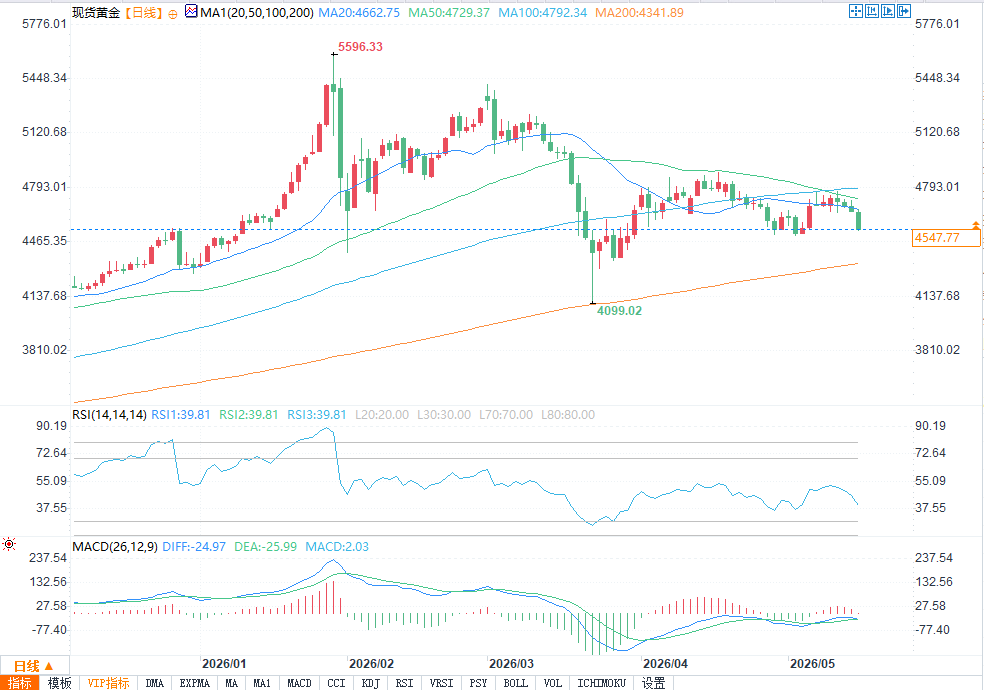
By looking at the current daily chart, we can see several key changes:
The moving average system has turned bearish across the board: At the beginning of the week, gold prices failed to break through the key moving average resistance levels such as MA20 ($4662.75), MA50 ($4729.37), and MA100 ($4792.34). On Friday, it even broke through the MA20 support, starting an accelerated decline.
A key support level is about to be broken: Gold prices touched a low of $4,531.99 during the day, approaching the previously mentioned long-term 61.8% Fibonacci support level of $4,541.88, before rebounding slightly to $4,547.68 at the end of the session.
The risk of a bull-bear dividing line is approaching: If the support at $4541.88 is breached, the next target is the pullback range of $4495.33 to $4401.84. The $4481.78 level (a 20% retracement from the historical high) is the dividing line between the bull and bear markets for gold. The ultimate support below is the 200-day moving average ($4341.89).
Indicator signals:
RSI(14): The current reading is 39.81, which has fallen below the 50 neutral line and is in the weak zone. It has not yet entered the oversold zone, indicating that there is still room for the downward momentum to be released.
MACD (26,12,9): After the DIFF line (-24.98) and DEA line (-25.99) formed a death cross below the zero axis, a brief golden cross occurred, but the red bars continued to shorten. The current MACD value is only 2.03, indicating that the rebound momentum is extremely weak and the bearish trend remains unchanged.
The US dollar dominates market trends.
The US dollar index has risen for several consecutive days this week, and climbed above the 99 mark on Friday. The only driving force behind this is inflation data.
Three consecutive weeks of record-breaking inflation data have completely rewritten expectations for the Federal Reserve's policy. Before this week, the market still anticipated a rate cut this year, but that expectation has now vanished entirely. The market now widely believes that the Fed will maintain high interest rates at least until the end of the year, and some traders are even starting to price in the possibility of further rate hikes.
The easing of expectations for interest rate cuts has boosted the US dollar, and since gold is priced in US dollars, the appreciation of the dollar has directly suppressed gold prices.
Gold is priced globally in US dollars. Every point the dollar index rises increases the cost of gold for buyers outside the US. Consequently, gold demand gradually shrinks. If trend traders flock to go long on the dollar, the decline in gold prices accelerates. Friday's plunge in gold prices from $4665.45 to $4531.99, a single-day fluctuation of $133, is a typical example of an accelerated decline, and certainly not a random market event.
Three rounds of inflation data completely reversed the market landscape.
The Consumer Price Index (CPI) released on Tuesday, the Producer Price Index (PPI) on Wednesday, and the Import Price Index on Thursday all exceeded market expectations, continuously delaying the Fed's interest rate cut timeline. The sharp drop in gold prices on Friday was a concentrated realization of the three consecutive negative inflationary factors.
Consecutive data releases have been sending the same signal, forcing trading institutions to reprice the Federal Reserve's policy path. Funds that had previously bet on further easing by the Fed have begun to exit the market on a large scale, putting downward pressure on gold.
The import price data released on Thursday is particularly noteworthy: energy prices saw their biggest monthly increase in four years, and energy costs will gradually be passed on to the inflation system, affecting consumer prices, producer prices, and import prices. With energy inflation remaining high, the Federal Reserve has no room to cut interest rates, and the market has given up any hope of further rate cuts.
US Treasury yields: another major driver of gold price declines
The yield on the 10-year U.S. Treasury note rose to 4.53%, nearing a one-year high.
Gold is a non-interest-bearing asset, and with the 10-year US Treasury yield exceeding 4.5%, it means that investors can consistently obtain an annualized return of over 4.5% by allocating to top-tier, low-risk US Treasury bonds globally. For every basis point increase in the US Treasury yield, the cost-effectiveness of allocating to non-interest-bearing gold further decreases.
Earlier this year, when US Treasury yields were low, many funds entered the market to increase their holdings of gold; now that yields are rising, investors are reassessing the return on investment, and profit-taking has taken the lead. Once key support levels are broken, the selling will accelerate, as was the case on Friday.
Why did geopolitical safe-haven demand fail to support gold prices?
The conflict in the Middle East continues, and shipping in the Strait of Hormuz remains partially restricted. Under normal circumstances, geopolitical risks would provide a floor for gold prices, but this week the safe-haven effect has completely failed.
The current market focus is on inflation, Federal Reserve policy, US Treasury yields and the dollar's trajectory. While geopolitical safe-haven demand objectively exists, its influence has been completely suppressed. This pattern has been in place since the end of February.
The transmission logic of escalating geopolitical conflicts → rising oil prices → higher inflation → Federal Reserve maintaining high interest rates → downward pressure on gold prices was once again confirmed on Friday.
Key points to watch in the future
Short-term support level: Gold prices held the key 61.8% Fibonacci retracement level at $4541.88 today, closing at $4547.68, but the rebound was weak. A break below this level early next week would open a downward channel, with the next target at the $4495.33-$4401.84 range. $4481.78 is a crucial level, marking the dividing line between bull and bear markets; a break below this level would officially usher in a technical bear market for gold.
Moving average resistance levels: The short-term resistance levels above are the MA20 ($4662.75) and MA50 ($4729.37). Before the negative factors of inflation and the US dollar ease, it will be difficult for gold prices to break through these moving average resistance levels.
Key fundamental variables: The US dollar holding steady above the 99 mark and the 10-year US Treasury yield remaining high at 4.53% are two major negative factors that continue to suppress gold prices. Only a decline in oil prices leading to a cooling of inflation, or a repricing of market expectations for a Fed rate cut, could reverse this bearish trend; otherwise, gold prices will likely remain on the downside.
The intraday price fluctuations reveal market sentiment: gold prices attempted to hold onto gains in the morning but subsequently encountered sharp selling pressure. Simultaneously, the US dollar index broke through the 99 mark, and the yield on the 10-year US Treasury note rose to 4.53%, nearing a one-year high. This combined negative impact of a stronger dollar and soaring US Treasury yields directly dragged down gold prices.
By looking at the current daily chart, we can see several key changes:
The moving average system has turned bearish across the board: At the beginning of the week, gold prices failed to break through the key moving average resistance levels such as MA20 ($4662.75), MA50 ($4729.37), and MA100 ($4792.34). On Friday, it even broke through the MA20 support, starting an accelerated decline.
A key support level is about to be broken: Gold prices touched a low of $4,531.99 during the day, approaching the previously mentioned long-term 61.8% Fibonacci support level of $4,541.88, before rebounding slightly to $4,547.68 at the end of the session.
The risk of a bull-bear dividing line is approaching: If the support at $4541.88 is breached, the next target is the pullback range of $4495.33 to $4401.84. The $4481.78 level (a 20% retracement from the historical high) is the dividing line between the bull and bear markets for gold. The ultimate support below is the 200-day moving average ($4341.89).
Indicator signals:
RSI(14): The current reading is 39.81, which has fallen below the 50 neutral line and is in the weak zone. It has not yet entered the oversold zone, indicating that there is still room for the downward momentum to be released.
MACD (26,12,9): After the DIFF line (-24.98) and DEA line (-25.99) formed a death cross below the zero axis, a brief golden cross occurred, but the red bars continued to shorten. The current MACD value is only 2.03, indicating that the rebound momentum is extremely weak and the bearish trend remains unchanged.
The US dollar dominates market trends.
The US dollar index has risen for several consecutive days this week, and climbed above the 99 mark on Friday. The only driving force behind this is inflation data.
Three consecutive weeks of record-breaking inflation data have completely rewritten expectations for the Federal Reserve's policy. Before this week, the market still anticipated a rate cut this year, but that expectation has now vanished entirely. The market now widely believes that the Fed will maintain high interest rates at least until the end of the year, and some traders are even starting to price in the possibility of further rate hikes.
The easing of expectations for interest rate cuts has boosted the US dollar, and since gold is priced in US dollars, the appreciation of the dollar has directly suppressed gold prices.
Gold is priced globally in US dollars. Every point the dollar index rises increases the cost of gold for buyers outside the US. Consequently, gold demand gradually shrinks. If trend traders flock to go long on the dollar, the decline in gold prices accelerates. Friday's plunge in gold prices from $4665.45 to $4531.99, a single-day fluctuation of $133, is a typical example of an accelerated decline, and certainly not a random market event.
Three rounds of inflation data completely reversed the market landscape.
The Consumer Price Index (CPI) released on Tuesday, the Producer Price Index (PPI) on Wednesday, and the Import Price Index on Thursday all exceeded market expectations, continuously delaying the Fed's interest rate cut timeline. The sharp drop in gold prices on Friday was a concentrated realization of the three consecutive negative inflationary factors.
Consecutive data releases have been sending the same signal, forcing trading institutions to reprice the Federal Reserve's policy path. Funds that had previously bet on further easing by the Fed have begun to exit the market on a large scale, putting downward pressure on gold.
The import price data released on Thursday is particularly noteworthy: energy prices saw their biggest monthly increase in four years, and energy costs will gradually be passed on to the inflation system, affecting consumer prices, producer prices, and import prices. With energy inflation remaining high, the Federal Reserve has no room to cut interest rates, and the market has given up any hope of further rate cuts.
US Treasury yields: another major driver of gold price declines
The yield on the 10-year U.S. Treasury note rose to 4.53%, nearing a one-year high.
Gold is a non-interest-bearing asset, and with the 10-year US Treasury yield exceeding 4.5%, it means that investors can consistently obtain an annualized return of over 4.5% by allocating to top-tier, low-risk US Treasury bonds globally. For every basis point increase in the US Treasury yield, the cost-effectiveness of allocating to non-interest-bearing gold further decreases.
Earlier this year, when US Treasury yields were low, many funds entered the market to increase their holdings of gold; now that yields are rising, investors are reassessing the return on investment, and profit-taking has taken the lead. Once key support levels are broken, the selling will accelerate, as was the case on Friday.
Why did geopolitical safe-haven demand fail to support gold prices?
The conflict in the Middle East continues, and shipping in the Strait of Hormuz remains partially restricted. Under normal circumstances, geopolitical risks would provide a floor for gold prices, but this week the safe-haven effect has completely failed.
The current market focus is on inflation, Federal Reserve policy, US Treasury yields and the dollar's trajectory. While geopolitical safe-haven demand objectively exists, its influence has been completely suppressed. This pattern has been in place since the end of February.
The transmission logic of escalating geopolitical conflicts → rising oil prices → higher inflation → Federal Reserve maintaining high interest rates → downward pressure on gold prices was once again confirmed on Friday.
Key points to watch in the future
Short-term support level: Gold prices held the key 61.8% Fibonacci retracement level at $4541.88 today, closing at $4547.68, but the rebound was weak. A break below this level early next week would open a downward channel, with the next target at the $4495.33-$4401.84 range. $4481.78 is a crucial level, marking the dividing line between bull and bear markets; a break below this level would officially usher in a technical bear market for gold.
Moving average resistance levels: The short-term resistance levels above are the MA20 ($4662.75) and MA50 ($4729.37). Before the negative factors of inflation and the US dollar ease, it will be difficult for gold prices to break through these moving average resistance levels.
Key fundamental variables: The US dollar holding steady above the 99 mark and the 10-year US Treasury yield remaining high at 4.53% are two major negative factors that continue to suppress gold prices. Only a decline in oil prices leading to a cooling of inflation, or a repricing of market expectations for a Fed rate cut, could reverse this bearish trend; otherwise, gold prices will likely remain on the downside.
- Risk Warning and Disclaimer
- The market involves risk, and trading may not be suitable for all investors. This article is for reference only and does not constitute personal investment advice, nor does it take into account certain users’ specific investment objectives, financial situation, or other needs. Any investment decisions made based on this information are at your own risk.