Gold prices plunged more than 2% in a single day; analysis of multiple pressure factors.
2026-05-16 02:20:55
On Friday (May 15), during the US trading session, spot gold prices fell to around $4,559 per ounce, a 2% drop for the day and a cumulative weekly decline of 3.29%. This significant pullback was not a random market fluctuation, but rather the result of a confluence of factors, including a stronger dollar, rising US Treasury yields, higher-than-expected inflation data, the transmission of soaring oil prices, and shrinking physical demand in India. As a traditional safe-haven asset and inflation hedge, gold's "no-yield" characteristic has been significantly weakened by the high-interest-rate environment in the current climate, leading to significant capital outflow pressure.
This article will provide an in-depth analysis from multiple dimensions, including the US dollar and yields, inflation expectations, oil price transmission, changes in demand, and technical factors, and will also explore short-term and medium- to long-term prospects.
US Dollar and Yields: The Most Direct Suppressive Force
There is a long-term, stable negative correlation between gold and the US dollar index and US Treasury yields. This is widely accepted in financial theory: a stronger dollar increases the cost of dollar-denominated gold for non-US investors, while rising US Treasury yields increase the opportunity cost of holding non-interest-bearing gold, leading to a shift of funds from gold to higher-yielding fixed-income assets. This week, the 10-year US Treasury yield rose to its highest level in nearly a year, and the US dollar index also rebounded to above 99, reaching a new high since April 8. This trend is closely related to expectations of Federal Reserve policy. In a high-inflation environment, market expectations that the Federal Reserve will maintain high interest rates or even raise rates have intensified, pushing up the dollar and yields. The "holding cost" of gold has consequently increased, leading many institutional investors to reduce their gold positions and shift to short-term US Treasury bonds or money market funds.
A stronger US dollar not only directly suppresses gold prices but also indirectly weakens gold demand by affecting capital flows in emerging markets. Many emerging economies, facing pressure to depreciate their currencies, are more inclined to prioritize stabilizing their foreign exchange reserves rather than increasing their gold holdings.
Furthermore, global capital allocation is also changing. Some hedge funds and ETFs have recently reported net outflows, further amplifying downward pressure on prices. In the short term, if the US dollar index continues to hold above 99 and attempts to break through 100, gold will face continued selling pressure.
Inflation data exceeded expectations, completely extinguishing expectations of interest rate cuts.
In April, the U.S. Consumer Price Index (CPI) rose 3.8% year-on-year (previous value 3.3%), reaching a new high since May 2023; the Producer Price Index (PPI) rose 6% year-on-year (previous value 4.3%), the highest since December 2023; retail sales grew 0.5% month-on-month, indicating that consumption remains resilient. These figures far exceeded market expectations, directly extinguishing market hopes for a Federal Reserve rate cut this year.
According to the CME FedWatch tool, after the data release, the market's expectation of a December rate hike surged from 33% to 45%, while the probability of a rate cut this year plummeted to near zero. This shift is crucial because gold is more attractive in a low-interest-rate environment—low interest rates reduce opportunity costs and are often accompanied by currency devaluation pressures.
The higher-than-expected inflation is driven by multiple factors. First, there's the direct transmission of energy price increases; second, there are localized disruptions in the supply chain and a still-tight labor market. Strong retail sales data indicate that while US consumers face high price pressures, there hasn't been a significant collapse in consumption, giving the Federal Reserve the confidence to maintain its restrictive monetary policy. From a policy transmission mechanism perspective, the Fed Chairman has recently emphasized the "data-dependent" principle. Until inflation clearly falls back to the 2% target, the window for interest rate cuts is unlikely to open. This has led to a steepening of the bond yield curve, further reducing the relative attractiveness of gold as a "zero-interest asset." Analysts generally believe that if the May and June CPI data continue to be overheated, the Fed may even reconsider raising interest rates later in 2026, which would exert longer-term downward pressure on gold.
The transmission mechanism of rising oil prices: geopolitical risks amplify inflationary pressures.
The ongoing tensions in the Strait of Hormuz are the core driver of the current oil price surge. This strait is a crucial chokepoint for global oil transportation, normally handling massive daily traffic. However, current ship traffic has only recovered to about 7% of pre-conflict levels (only about 10 ships in 24 hours, compared to a normal 140). This bottleneck has directly pushed up global energy prices.
This week, Brent crude rose 7.8%, hovering above $109 per barrel, while WTI crude also broke through the $100 mark. Rising oil prices affect gold through multiple pathways: Cost-push inflation: Higher oil prices directly increase production, transportation, and manufacturing costs, which companies then pass on to consumers, exacerbating overall inflationary pressures. This, in turn, reinforces the high-interest-rate environment, creating a double drag on gold prices.
The transmission chain of "oil prices → inflation → high interest rates → pressure on gold" was validated by the market in 2022. Currently, high oil prices are not only affecting the United States, but also impacting European and Asian economies through global supply chains, increasing the risk of global stagflation.
Safe-haven flows: While geopolitical tensions typically benefit gold, when oil prices dominate safe-haven sentiment, funds may flow into energy-related assets rather than gold. Some investors believe that the current rise in oil prices is a "real economic shock," rather than simply a demand for financial safe havens.
If tensions in the Strait of Hormuz persist, oil prices may further test the $110-$120 range, which would increase the risk of a hard landing for the global economy and test the policy response capabilities of central banks around the world.
On the demand side: Discounts in India surged to record highs, while physical consumption contracted significantly.
As the world's second-largest gold consumer (after China), India's demand fluctuations significantly impact international gold prices. This week, India's gold import discounts surged to a record high due to a substantial increase in import tariffs. The government raised import tariffs on gold and silver from 6% to 15% (10% basic tariff + 5% agricultural infrastructure tax) in an effort to curb imports, alleviate pressure on foreign exchange reserves, and support the rupee exchange rate.
This policy directly increased the landed costs of officially imported gold, leading to a significant contraction in physical demand. Indian jewelers and investors faced higher gold prices, and some consumers chose to postpone purchases or turn to the secondary market ahead of traditional peak seasons such as weddings. The price difference between local and international gold prices widened, reaching record discount levels (reportedly exceeding $200/ounce at one point), reflecting weak physical buying.
Besides tariffs, demand from other Asian consumer countries, such as China, is also constrained by high gold prices and local economic factors. Although central banks continue to buy gold as a reserve diversification tool, private investment and jewelry demand show significant price sensitivity at higher price levels. This contrasts sharply with the strong demand expected in 2025.
Technical Analysis: The trend is bearish, and key support levels are being tested.
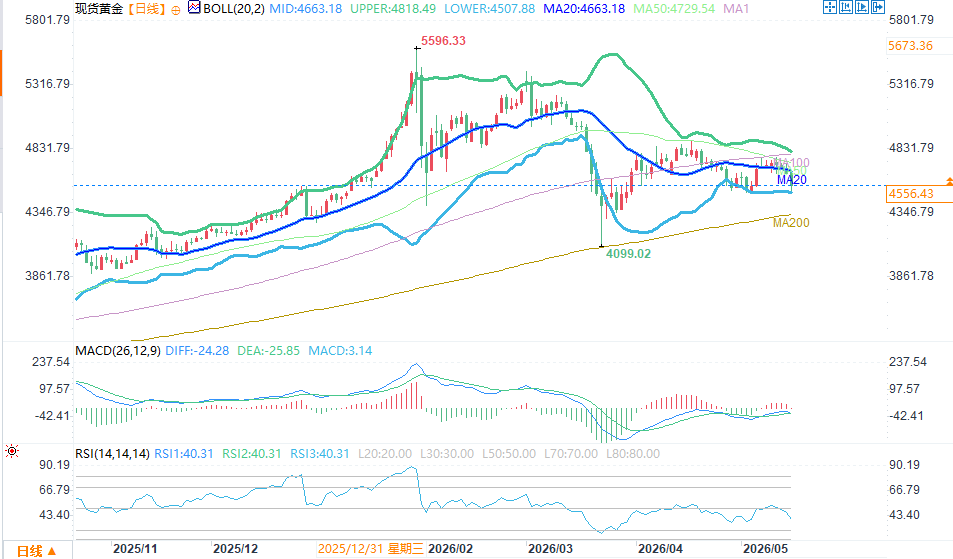
(Spot gold daily chart source: EasyForex)
From the daily chart, XAU/USD is currently below the 20-day Bollinger Band middle line (approximately $4,662), with a Relative Strength Index (RSI) of 40.23 and an Average Directional Movement Index (ADX) close to 17, indicating weak trend momentum and a downward trend within a range. Downside support levels are at $4,510, $4,350, and $4,100. A break below $4,510 could open up further downside potential.
On the upside, $4,662 is a key resistance level. Only a recovery and sustained hold above this level for several days can be considered a short-term stabilization signal. The MACD indicator also shows a continued death cross, and trading volume has increased during the decline, indicating that bears are in control. With technical and fundamental factors converging, a short-term rebound is unlikely. However, gold has historically experienced technical rebounds in oversold territory; investors can monitor whether the RSI enters oversold territory below 30 as a potential entry point.
Market Outlook
The current pressure on gold is a result of the combined weakening of three factors: expectations of macroeconomic tightening, geopolitical and energy shocks, and changes in demand-side policies, rather than being driven by a single factor. This multi-faceted pressure is likely to persist in the short term, keeping gold price volatility high. However, in the medium to long term, favorable factors remain in market sentiment. Global geopolitical uncertainty, continued central bank gold purchases, the trend of de-dollarization, and the potential risk of economic slowdown all provide structural support for gold.
Analyst Ross Norman points out, "In the long run, market sentiment is favorable for gold prices, but short-term trends are difficult to predict." Several institutions, such as JPMorgan Chase, still maintain their optimistic forecast that gold prices will move above $5,000 by 2026, provided that inflation gradually declines and geopolitical risks ease.
In terms of investor strategy, a cautious approach is advisable in the short term, paying close attention to statements from Federal Reserve officials, oil price trends, and the recovery of Indian demand. Long-term investors may consider phased entry below $4,400, using the US dollar index and real yields as dynamic hedging tools.
At 02:19 Beijing time, spot gold was trading at $4,553.65 per ounce, down 2.12%.
This article will provide an in-depth analysis from multiple dimensions, including the US dollar and yields, inflation expectations, oil price transmission, changes in demand, and technical factors, and will also explore short-term and medium- to long-term prospects.
US Dollar and Yields: The Most Direct Suppressive Force
There is a long-term, stable negative correlation between gold and the US dollar index and US Treasury yields. This is widely accepted in financial theory: a stronger dollar increases the cost of dollar-denominated gold for non-US investors, while rising US Treasury yields increase the opportunity cost of holding non-interest-bearing gold, leading to a shift of funds from gold to higher-yielding fixed-income assets. This week, the 10-year US Treasury yield rose to its highest level in nearly a year, and the US dollar index also rebounded to above 99, reaching a new high since April 8. This trend is closely related to expectations of Federal Reserve policy. In a high-inflation environment, market expectations that the Federal Reserve will maintain high interest rates or even raise rates have intensified, pushing up the dollar and yields. The "holding cost" of gold has consequently increased, leading many institutional investors to reduce their gold positions and shift to short-term US Treasury bonds or money market funds.
A stronger US dollar not only directly suppresses gold prices but also indirectly weakens gold demand by affecting capital flows in emerging markets. Many emerging economies, facing pressure to depreciate their currencies, are more inclined to prioritize stabilizing their foreign exchange reserves rather than increasing their gold holdings.
Furthermore, global capital allocation is also changing. Some hedge funds and ETFs have recently reported net outflows, further amplifying downward pressure on prices. In the short term, if the US dollar index continues to hold above 99 and attempts to break through 100, gold will face continued selling pressure.
Inflation data exceeded expectations, completely extinguishing expectations of interest rate cuts.
In April, the U.S. Consumer Price Index (CPI) rose 3.8% year-on-year (previous value 3.3%), reaching a new high since May 2023; the Producer Price Index (PPI) rose 6% year-on-year (previous value 4.3%), the highest since December 2023; retail sales grew 0.5% month-on-month, indicating that consumption remains resilient. These figures far exceeded market expectations, directly extinguishing market hopes for a Federal Reserve rate cut this year.
According to the CME FedWatch tool, after the data release, the market's expectation of a December rate hike surged from 33% to 45%, while the probability of a rate cut this year plummeted to near zero. This shift is crucial because gold is more attractive in a low-interest-rate environment—low interest rates reduce opportunity costs and are often accompanied by currency devaluation pressures.
The higher-than-expected inflation is driven by multiple factors. First, there's the direct transmission of energy price increases; second, there are localized disruptions in the supply chain and a still-tight labor market. Strong retail sales data indicate that while US consumers face high price pressures, there hasn't been a significant collapse in consumption, giving the Federal Reserve the confidence to maintain its restrictive monetary policy. From a policy transmission mechanism perspective, the Fed Chairman has recently emphasized the "data-dependent" principle. Until inflation clearly falls back to the 2% target, the window for interest rate cuts is unlikely to open. This has led to a steepening of the bond yield curve, further reducing the relative attractiveness of gold as a "zero-interest asset." Analysts generally believe that if the May and June CPI data continue to be overheated, the Fed may even reconsider raising interest rates later in 2026, which would exert longer-term downward pressure on gold.
The transmission mechanism of rising oil prices: geopolitical risks amplify inflationary pressures.
The ongoing tensions in the Strait of Hormuz are the core driver of the current oil price surge. This strait is a crucial chokepoint for global oil transportation, normally handling massive daily traffic. However, current ship traffic has only recovered to about 7% of pre-conflict levels (only about 10 ships in 24 hours, compared to a normal 140). This bottleneck has directly pushed up global energy prices.
This week, Brent crude rose 7.8%, hovering above $109 per barrel, while WTI crude also broke through the $100 mark. Rising oil prices affect gold through multiple pathways: Cost-push inflation: Higher oil prices directly increase production, transportation, and manufacturing costs, which companies then pass on to consumers, exacerbating overall inflationary pressures. This, in turn, reinforces the high-interest-rate environment, creating a double drag on gold prices.
The transmission chain of "oil prices → inflation → high interest rates → pressure on gold" was validated by the market in 2022. Currently, high oil prices are not only affecting the United States, but also impacting European and Asian economies through global supply chains, increasing the risk of global stagflation.
Safe-haven flows: While geopolitical tensions typically benefit gold, when oil prices dominate safe-haven sentiment, funds may flow into energy-related assets rather than gold. Some investors believe that the current rise in oil prices is a "real economic shock," rather than simply a demand for financial safe havens.
If tensions in the Strait of Hormuz persist, oil prices may further test the $110-$120 range, which would increase the risk of a hard landing for the global economy and test the policy response capabilities of central banks around the world.
On the demand side: Discounts in India surged to record highs, while physical consumption contracted significantly.
As the world's second-largest gold consumer (after China), India's demand fluctuations significantly impact international gold prices. This week, India's gold import discounts surged to a record high due to a substantial increase in import tariffs. The government raised import tariffs on gold and silver from 6% to 15% (10% basic tariff + 5% agricultural infrastructure tax) in an effort to curb imports, alleviate pressure on foreign exchange reserves, and support the rupee exchange rate.
This policy directly increased the landed costs of officially imported gold, leading to a significant contraction in physical demand. Indian jewelers and investors faced higher gold prices, and some consumers chose to postpone purchases or turn to the secondary market ahead of traditional peak seasons such as weddings. The price difference between local and international gold prices widened, reaching record discount levels (reportedly exceeding $200/ounce at one point), reflecting weak physical buying.
Besides tariffs, demand from other Asian consumer countries, such as China, is also constrained by high gold prices and local economic factors. Although central banks continue to buy gold as a reserve diversification tool, private investment and jewelry demand show significant price sensitivity at higher price levels. This contrasts sharply with the strong demand expected in 2025.
Technical Analysis: The trend is bearish, and key support levels are being tested.
(Spot gold daily chart source: EasyForex)
From the daily chart, XAU/USD is currently below the 20-day Bollinger Band middle line (approximately $4,662), with a Relative Strength Index (RSI) of 40.23 and an Average Directional Movement Index (ADX) close to 17, indicating weak trend momentum and a downward trend within a range. Downside support levels are at $4,510, $4,350, and $4,100. A break below $4,510 could open up further downside potential.
On the upside, $4,662 is a key resistance level. Only a recovery and sustained hold above this level for several days can be considered a short-term stabilization signal. The MACD indicator also shows a continued death cross, and trading volume has increased during the decline, indicating that bears are in control. With technical and fundamental factors converging, a short-term rebound is unlikely. However, gold has historically experienced technical rebounds in oversold territory; investors can monitor whether the RSI enters oversold territory below 30 as a potential entry point.
Market Outlook
The current pressure on gold is a result of the combined weakening of three factors: expectations of macroeconomic tightening, geopolitical and energy shocks, and changes in demand-side policies, rather than being driven by a single factor. This multi-faceted pressure is likely to persist in the short term, keeping gold price volatility high. However, in the medium to long term, favorable factors remain in market sentiment. Global geopolitical uncertainty, continued central bank gold purchases, the trend of de-dollarization, and the potential risk of economic slowdown all provide structural support for gold.
Analyst Ross Norman points out, "In the long run, market sentiment is favorable for gold prices, but short-term trends are difficult to predict." Several institutions, such as JPMorgan Chase, still maintain their optimistic forecast that gold prices will move above $5,000 by 2026, provided that inflation gradually declines and geopolitical risks ease.
In terms of investor strategy, a cautious approach is advisable in the short term, paying close attention to statements from Federal Reserve officials, oil price trends, and the recovery of Indian demand. Long-term investors may consider phased entry below $4,400, using the US dollar index and real yields as dynamic hedging tools.
At 02:19 Beijing time, spot gold was trading at $4,553.65 per ounce, down 2.12%.
- Risk Warning and Disclaimer
- The market involves risk, and trading may not be suitable for all investors. This article is for reference only and does not constitute personal investment advice, nor does it take into account certain users’ specific investment objectives, financial situation, or other needs. Any investment decisions made based on this information are at your own risk.