A stronger dollar dampened safe-haven demand, and gold prices remained range-bound.
2026-05-19 15:40:43
International gold prices continued their weakness during Tuesday's European session, with spot gold (XAU/USD) trading around $4,550, close to its lowest level since March 30. While the situation in the Middle East has not fully de-escalated, market expectations of a potential agreement between the US and Iran are diminishing gold's safe-haven appeal.

US President Donald Trump said on Monday that the US has suspended planned military action against Iran at the request of Qatar, Saudi Arabia, and the United Arab Emirates. Trump also emphasized that the US military will remain prepared for full-scale military action if the two sides cannot reach an agreement.
While the market holds some optimism regarding a potential diplomatic agreement, Iran's tough stance remains a cause for investor caution. Responding to Trump's warning that "time is running out," Iranian President Pezechzian stated that Iran will not yield to any power and emphasized that any negotiations must be based on safeguarding national interests.
While the situation in the Middle East has not escalated further, market risk aversion has cooled significantly . As concerns about the risk of a full-blown conflict have eased, some of the safe-haven funds that had previously flowed into the gold market are beginning to flow back into dollar assets.
Meanwhile, expectations of high interest rates from the Federal Reserve continue to be a significant factor suppressing gold prices. Recent US inflation data has consistently exceeded market expectations, and rising energy prices have further exacerbated market concerns about future inflationary pressures.
According to the CME FedWatch tool, the market has largely ruled out the possibility of a Federal Reserve rate cut in 2026. Instead, the market expects a nearly 40% probability of another 25 basis point rate hike by the Fed before the end of the year . This expectation has driven the dollar index higher and kept US Treasury yields high.
The yield on 30-year US Treasury bonds is currently hovering near its highest level since 2023, reflecting persistent market concerns about long-term inflation and fiscal deficits. This high-yield environment significantly enhances the attractiveness of dollar-denominated assets and diminishes the investment value of gold, a non-interest-bearing asset.
Furthermore, the market is currently awaiting the release of the Federal Reserve meeting minutes on Wednesday, hoping to glean more clues about the future path of interest rates. Investors remain cautious about the gold market as the Fed's policy outlook remains unclear.
Market analysts say that as long as US yields remain high, gold may continue to face downward pressure in the short term.
From a technical perspective, gold remains in a bearish structure on the 1-hour chart. The price continues to trade below the 100-hour simple moving average (SMA), indicating that the short-term downtrend has not yet been reversed. Although the previous rebound from the lows briefly improved market sentiment, the overall upward momentum has begun to weaken. While the MACD indicator is still above the zero line, the momentum value has clearly dropped to around 3.32, showing that bullish strength is waning. Meanwhile, the Relative Strength Index (RSI) is around 51.7, suggesting that the market has only limited rebound momentum and has not yet formed a clear upward trend.
Current technical indicators suggest that the psychological level of $4,500 has become a crucial support area for the market. If gold prices decisively break below this level and further fall below the overnight low near $4,480, it could open up further downside potential. On the upside, the 100-hour moving average around $4,625 forms a key resistance zone. Only a break and hold above $4,625 could alleviate current bearish pressure and propel the market back into a phase of recovery.
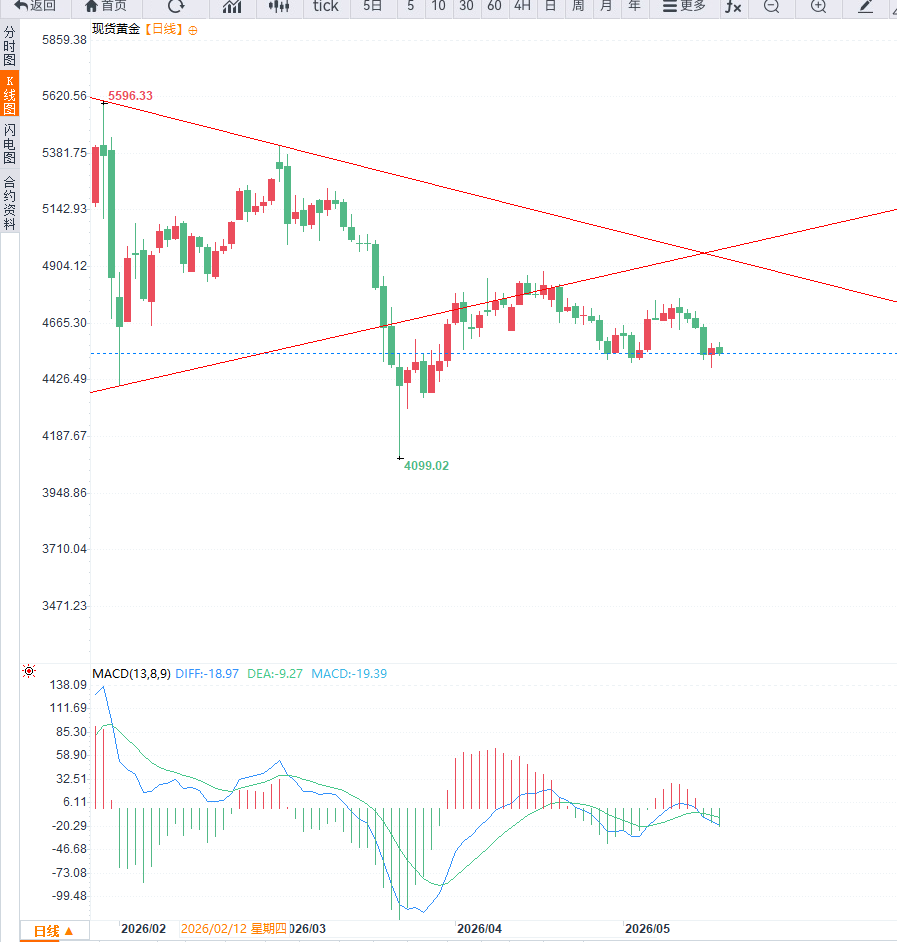
From a daily chart perspective, gold has entered a clear consolidation phase after its previous surge. The 20-day exponential moving average has begun to flatten, while the RSI has continued to decline from the overbought zone, reflecting a cooling of bullish momentum. Although the MACD still maintains a bullish structure, the red momentum bars are continuously narrowing, indicating that the upward trend is slowing.
Overall, the gold market is currently in a phase of balancing between easing geopolitical risk aversion and a strengthening of the Federal Reserve's hawkish stance. In the short term, expectations regarding Fed policy, US Treasury yields, and developments in the Middle East will continue to dominate gold price movements.
Editor's Summary : Gold is currently facing significant macroeconomic pressure. While uncertainty persists in the Middle East, market expectations for a diplomatic solution are weakening safe-haven demand for gold. Simultaneously, high inflation and high interest rates in the US have strengthened the advantage of the US dollar and US Treasury yields, putting overall pressure on gold. From a technical perspective, $4,500 has become a key psychological support level; a breach of this level could open up further downside potential. However, if the situation in the Middle East deteriorates again, or if the Federal Reserve releases dovish signals, gold could quickly regain safe-haven buying support. Market volatility is expected to remain high in the future.
US President Donald Trump said on Monday that the US has suspended planned military action against Iran at the request of Qatar, Saudi Arabia, and the United Arab Emirates. Trump also emphasized that the US military will remain prepared for full-scale military action if the two sides cannot reach an agreement.
While the market holds some optimism regarding a potential diplomatic agreement, Iran's tough stance remains a cause for investor caution. Responding to Trump's warning that "time is running out," Iranian President Pezechzian stated that Iran will not yield to any power and emphasized that any negotiations must be based on safeguarding national interests.
While the situation in the Middle East has not escalated further, market risk aversion has cooled significantly . As concerns about the risk of a full-blown conflict have eased, some of the safe-haven funds that had previously flowed into the gold market are beginning to flow back into dollar assets.
Meanwhile, expectations of high interest rates from the Federal Reserve continue to be a significant factor suppressing gold prices. Recent US inflation data has consistently exceeded market expectations, and rising energy prices have further exacerbated market concerns about future inflationary pressures.
According to the CME FedWatch tool, the market has largely ruled out the possibility of a Federal Reserve rate cut in 2026. Instead, the market expects a nearly 40% probability of another 25 basis point rate hike by the Fed before the end of the year . This expectation has driven the dollar index higher and kept US Treasury yields high.
The yield on 30-year US Treasury bonds is currently hovering near its highest level since 2023, reflecting persistent market concerns about long-term inflation and fiscal deficits. This high-yield environment significantly enhances the attractiveness of dollar-denominated assets and diminishes the investment value of gold, a non-interest-bearing asset.
Furthermore, the market is currently awaiting the release of the Federal Reserve meeting minutes on Wednesday, hoping to glean more clues about the future path of interest rates. Investors remain cautious about the gold market as the Fed's policy outlook remains unclear.
Market analysts say that as long as US yields remain high, gold may continue to face downward pressure in the short term.
From a technical perspective, gold remains in a bearish structure on the 1-hour chart. The price continues to trade below the 100-hour simple moving average (SMA), indicating that the short-term downtrend has not yet been reversed. Although the previous rebound from the lows briefly improved market sentiment, the overall upward momentum has begun to weaken. While the MACD indicator is still above the zero line, the momentum value has clearly dropped to around 3.32, showing that bullish strength is waning. Meanwhile, the Relative Strength Index (RSI) is around 51.7, suggesting that the market has only limited rebound momentum and has not yet formed a clear upward trend.
Current technical indicators suggest that the psychological level of $4,500 has become a crucial support area for the market. If gold prices decisively break below this level and further fall below the overnight low near $4,480, it could open up further downside potential. On the upside, the 100-hour moving average around $4,625 forms a key resistance zone. Only a break and hold above $4,625 could alleviate current bearish pressure and propel the market back into a phase of recovery.
From a daily chart perspective, gold has entered a clear consolidation phase after its previous surge. The 20-day exponential moving average has begun to flatten, while the RSI has continued to decline from the overbought zone, reflecting a cooling of bullish momentum. Although the MACD still maintains a bullish structure, the red momentum bars are continuously narrowing, indicating that the upward trend is slowing.
Overall, the gold market is currently in a phase of balancing between easing geopolitical risk aversion and a strengthening of the Federal Reserve's hawkish stance. In the short term, expectations regarding Fed policy, US Treasury yields, and developments in the Middle East will continue to dominate gold price movements.
Editor's Summary : Gold is currently facing significant macroeconomic pressure. While uncertainty persists in the Middle East, market expectations for a diplomatic solution are weakening safe-haven demand for gold. Simultaneously, high inflation and high interest rates in the US have strengthened the advantage of the US dollar and US Treasury yields, putting overall pressure on gold. From a technical perspective, $4,500 has become a key psychological support level; a breach of this level could open up further downside potential. However, if the situation in the Middle East deteriorates again, or if the Federal Reserve releases dovish signals, gold could quickly regain safe-haven buying support. Market volatility is expected to remain high in the future.
- Risk Warning and Disclaimer
- The market involves risk, and trading may not be suitable for all investors. This article is for reference only and does not constitute personal investment advice, nor does it take into account certain users’ specific investment objectives, financial situation, or other needs. Any investment decisions made based on this information are at your own risk.