Soaring US Treasury yields and a strong dollar weighed on gold prices, with bears taking control after gold fell below $4,500.
2026-05-20 14:37:05
Spot gold continued its downward pressure during Asian trading hours on Wednesday, with prices falling to around $4,470, a new low since March 30. As the US dollar index remained at a six-week high and US Treasury yields continued to rise, bearish pressure on the gold market intensified significantly. The core logic of the current gold market has gradually shifted from "geopolitical safe-haven buying" to "dollar and interest rate suppression."

Despite the ongoing tensions in the Middle East, markets remain cautious about a potential comprehensive agreement between the US and Iran in the near future. US President Trump stated on Tuesday that the US might launch another military strike against Iran if an agreement is not reached. He also revealed that the US had previously postponed military action after receiving requests from Gulf leaders. However, US Vice President Vance stated that negotiations between the US and Iran have made some progress, and neither side wants to revert to a full-blown military conflict.
Despite this, significant disagreements remain in the market regarding the Iranian nuclear issue and shipping in the Strait of Hormuz, meaning that Middle East risks have not truly subsided. Typically, escalating geopolitical risks drive up gold prices, but currently, safe-haven funds are flowing more towards dollar assets than gold. This is primarily because the dollar currently possesses both "safe-haven attributes" and "high-yield advantages."
With international crude oil prices remaining high, market concerns about a resurgence of global inflation have increased significantly. The ongoing shipping issues in the Strait of Hormuz continue to impact global energy supply expectations, pushing WTI crude oil prices near their monthly highs. Rising energy prices mean that major central banks worldwide may need to maintain high interest rates for a longer period, which puts significant pressure on gold, a non-yielding asset.
According to the CME Group's FedWatch tool, the market is now betting on a greater than 55% probability of the Federal Reserve raising interest rates by more than 25 basis points in 2026. This shift in expectations has significantly increased the attractiveness of dollar-denominated assets. Philadelphia Fed President Anna Paulson has also recently signaled a hawkish stance. She stated that further rate hikes may still be appropriate if future economic growth continues to exceed potential levels or if new inflation risks re-emerge.
As a result, US Treasury yields have surged recently. The yield on the 30-year US Treasury note rose to 5.20%, its highest level in nearly 19 years; the yield on the 10-year Treasury note remained above 4.68%. This high-yield environment significantly reduces the attractiveness of gold, as gold itself does not offer interest income. When US bond yields continue to rise, funds typically flow from the gold market to bonds and dollar assets.
Meanwhile, the continued strength of the US dollar index has further suppressed gold prices denominated in US dollars. The dollar index has now risen to its highest level since early April, indicating that global capital continues to flow into the dollar market. The market is currently awaiting the Federal Reserve meeting minutes to further observe the Fed's internal stance on the future path of interest rates. If the minutes remain hawkish, gold may face further downward pressure.
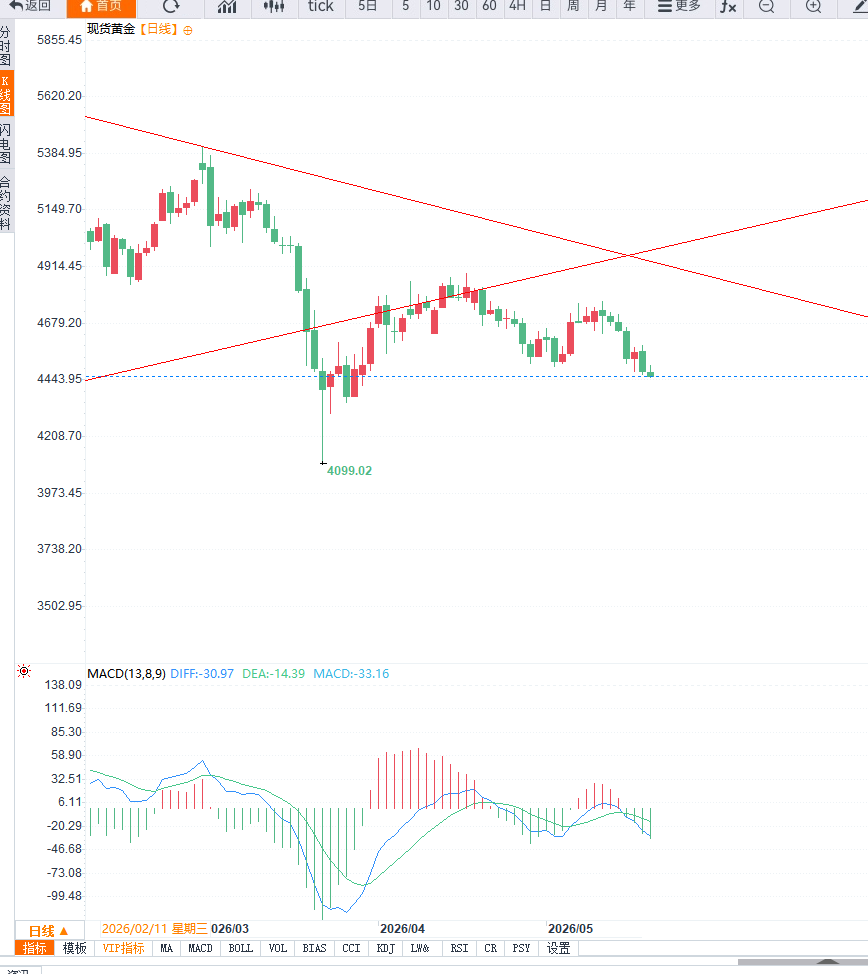
From a technical perspective, the daily chart for gold has clearly weakened. After gold prices broke below the $4,500 level, bearish sentiment quickly intensified. $4,500 is not only a significant psychological support level but also a key technical defense zone within the previous uptrend. The market is now viewing a break below $4,500 as a new bearish trigger signal. The daily chart shows that recent highs for gold have been consistently lower, while short-term moving averages have begun to turn downwards, indicating that the previous strong upward structure has been significantly damaged. The 14-day Relative Strength Index (RSI) is currently trading in the mid-30 range, showing a clearly bearish market momentum, but it has not yet entered an extremely oversold state, therefore, there is still room for further price correction.
Meanwhile, the MACD indicator has entered negative territory across the board, further reinforcing the current downtrend. However, from a longer-term perspective, gold is still trading above its 200-day simple moving average (SMA). The 200-day SMA is currently around $4363, which is also the most crucial medium- to long-term support level for the market. As long as gold can maintain its position above the 200-day moving average, the current movement is more likely a deep correction within an uptrend than a complete reversal of the long-term trend. However, if the US dollar continues to strengthen and US Treasury yields rise further, a decisive break below the $4360 area for gold could open up more room for further correction.
Looking at the upside, $4,500 has transformed from a previous support level into the first major resistance level. If gold prices experience a technical rebound, the $4,540 to $4,560 area will become the next key resistance zone. If gold fails to regain a foothold above $4,500, it may continue to move towards the $4,400 or even $4,360 area in the short term.
Overall, the current gold market is driven by a core trading logic of "a strong dollar + high yields suppressing prices." In the short term, expectations regarding Federal Reserve policy, the trend of US Treasury yields, and changes in the Middle East situation will remain key variables determining the direction of gold prices.
Editor's Summary : The gold market has entered a clearly weak adjustment phase. While the Middle East situation continues to provide some safe-haven support for gold, the strong dollar and soaring US Treasury yields are significantly weakening its appeal. From a market structure perspective, investors are currently more focused on the impact of inflation risks on the Federal Reserve's policy path, rather than simply on geopolitical safe-haven logic. This has significantly increased the short-term pressure on gold. Technically, after falling below $4,500, gold has entered a critical adjustment phase. The market will focus on the Fed meeting minutes, changes in US Treasury yields, and developments in the Middle East. If the dollar continues to be strong, gold may further test the support near the 200-day moving average.
Despite the ongoing tensions in the Middle East, markets remain cautious about a potential comprehensive agreement between the US and Iran in the near future. US President Trump stated on Tuesday that the US might launch another military strike against Iran if an agreement is not reached. He also revealed that the US had previously postponed military action after receiving requests from Gulf leaders. However, US Vice President Vance stated that negotiations between the US and Iran have made some progress, and neither side wants to revert to a full-blown military conflict.
Despite this, significant disagreements remain in the market regarding the Iranian nuclear issue and shipping in the Strait of Hormuz, meaning that Middle East risks have not truly subsided. Typically, escalating geopolitical risks drive up gold prices, but currently, safe-haven funds are flowing more towards dollar assets than gold. This is primarily because the dollar currently possesses both "safe-haven attributes" and "high-yield advantages."
With international crude oil prices remaining high, market concerns about a resurgence of global inflation have increased significantly. The ongoing shipping issues in the Strait of Hormuz continue to impact global energy supply expectations, pushing WTI crude oil prices near their monthly highs. Rising energy prices mean that major central banks worldwide may need to maintain high interest rates for a longer period, which puts significant pressure on gold, a non-yielding asset.
According to the CME Group's FedWatch tool, the market is now betting on a greater than 55% probability of the Federal Reserve raising interest rates by more than 25 basis points in 2026. This shift in expectations has significantly increased the attractiveness of dollar-denominated assets. Philadelphia Fed President Anna Paulson has also recently signaled a hawkish stance. She stated that further rate hikes may still be appropriate if future economic growth continues to exceed potential levels or if new inflation risks re-emerge.
As a result, US Treasury yields have surged recently. The yield on the 30-year US Treasury note rose to 5.20%, its highest level in nearly 19 years; the yield on the 10-year Treasury note remained above 4.68%. This high-yield environment significantly reduces the attractiveness of gold, as gold itself does not offer interest income. When US bond yields continue to rise, funds typically flow from the gold market to bonds and dollar assets.
Meanwhile, the continued strength of the US dollar index has further suppressed gold prices denominated in US dollars. The dollar index has now risen to its highest level since early April, indicating that global capital continues to flow into the dollar market. The market is currently awaiting the Federal Reserve meeting minutes to further observe the Fed's internal stance on the future path of interest rates. If the minutes remain hawkish, gold may face further downward pressure.
From a technical perspective, the daily chart for gold has clearly weakened. After gold prices broke below the $4,500 level, bearish sentiment quickly intensified. $4,500 is not only a significant psychological support level but also a key technical defense zone within the previous uptrend. The market is now viewing a break below $4,500 as a new bearish trigger signal. The daily chart shows that recent highs for gold have been consistently lower, while short-term moving averages have begun to turn downwards, indicating that the previous strong upward structure has been significantly damaged. The 14-day Relative Strength Index (RSI) is currently trading in the mid-30 range, showing a clearly bearish market momentum, but it has not yet entered an extremely oversold state, therefore, there is still room for further price correction.
Meanwhile, the MACD indicator has entered negative territory across the board, further reinforcing the current downtrend. However, from a longer-term perspective, gold is still trading above its 200-day simple moving average (SMA). The 200-day SMA is currently around $4363, which is also the most crucial medium- to long-term support level for the market. As long as gold can maintain its position above the 200-day moving average, the current movement is more likely a deep correction within an uptrend than a complete reversal of the long-term trend. However, if the US dollar continues to strengthen and US Treasury yields rise further, a decisive break below the $4360 area for gold could open up more room for further correction.
Looking at the upside, $4,500 has transformed from a previous support level into the first major resistance level. If gold prices experience a technical rebound, the $4,540 to $4,560 area will become the next key resistance zone. If gold fails to regain a foothold above $4,500, it may continue to move towards the $4,400 or even $4,360 area in the short term.
Overall, the current gold market is driven by a core trading logic of "a strong dollar + high yields suppressing prices." In the short term, expectations regarding Federal Reserve policy, the trend of US Treasury yields, and changes in the Middle East situation will remain key variables determining the direction of gold prices.
Editor's Summary : The gold market has entered a clearly weak adjustment phase. While the Middle East situation continues to provide some safe-haven support for gold, the strong dollar and soaring US Treasury yields are significantly weakening its appeal. From a market structure perspective, investors are currently more focused on the impact of inflation risks on the Federal Reserve's policy path, rather than simply on geopolitical safe-haven logic. This has significantly increased the short-term pressure on gold. Technically, after falling below $4,500, gold has entered a critical adjustment phase. The market will focus on the Fed meeting minutes, changes in US Treasury yields, and developments in the Middle East. If the dollar continues to be strong, gold may further test the support near the 200-day moving average.
- Risk Warning and Disclaimer
- The market involves risk, and trading may not be suitable for all investors. This article is for reference only and does not constitute personal investment advice, nor does it take into account certain users’ specific investment objectives, financial situation, or other needs. Any investment decisions made based on this information are at your own risk.