Crude Oil Analysis: Geopolitical Games in a Triangle Consolidation Pattern
2026-05-21 02:33:32
On Wednesday (May 20), during the US trading session, WTI crude oil experienced a significant plunge, with the decline widening to as much as 6%, hitting a low of $96.94 per barrel. Influenced by the final stage of US-Iran negotiations and the rising expectations of a peace agreement, oil prices came under heavy pressure and approached a key support area.

From a technical perspective, WTI crude oil is currently still trading at the end of a symmetrical triangle consolidation on the daily chart. The window for a technical breakout is narrowing further. The fundamentals are primarily driven by geopolitical tensions with Iran, and the market's balance between bulls and bears has been disrupted by the recent sharp drop.
Technical Analysis
Observing the daily chart, WTI crude oil is still showing a typical symmetrical triangle consolidation pattern. This pattern was formed after the pullback from the previous high (around $119-$120). The upper boundary is the downtrend line, and the lower boundary is the uptrend line. The lower boundary coincides with the key moving average. The price oscillates repeatedly between the two trend lines, and the volatility is gradually narrowing. This pattern is highly consistent with the current dual expectations of "peace vs. war" in the Iranian situation.
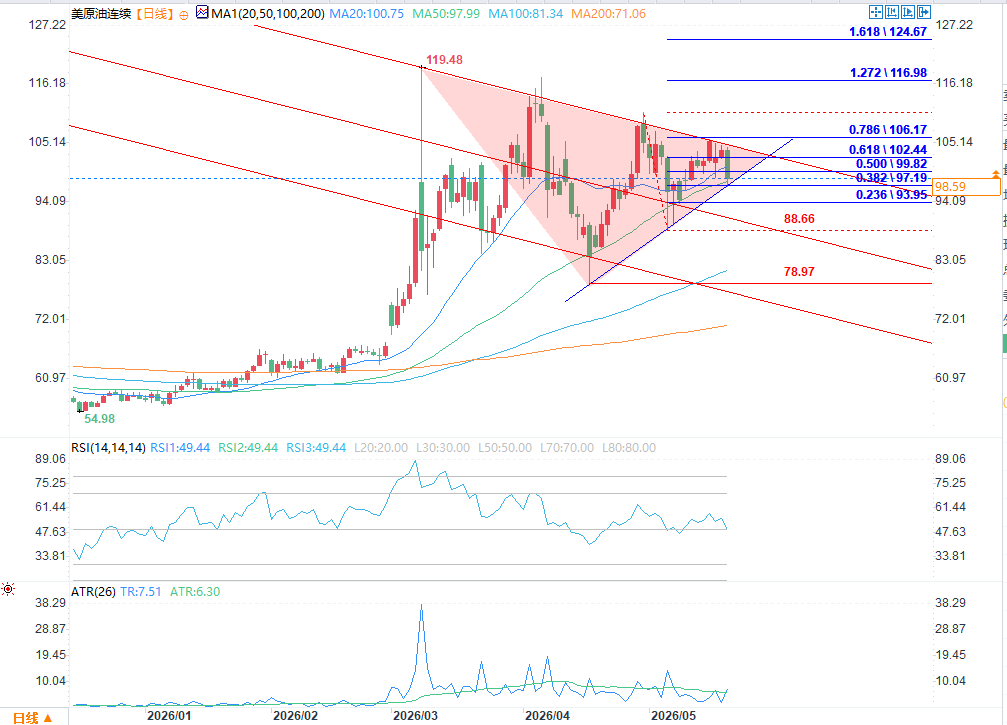
(WTI crude oil daily chart source: FX678)
Given tonight's sharp drop, oil prices have quickly fallen to the lower trendline of the triangle pattern and near key moving averages. Currently, it is in a critical testing phase at the end of the pattern. Trading volume has increased in stages along with the sharp drop, breaking the previous pattern of consolidation and shrinkage, which is consistent with the volume characteristics before a breakout at the end of the triangle pattern.
Regarding the moving average system, the price, affected by tonight's sharp drop, is testing the 50-day moving average (MA50, approximately 97.98). This level also serves as a crucial support level for the lower trendline of the triangle pattern. If it holds effectively, the consolidation-biased bullish trend can be maintained; however, a decisive break below this level would confirm a downward breakout, opening up further downside potential. The MA20 provides short-term resistance, while the MA100/MA200 forms multiple resistance and long-term support levels at mid-to-high levels. Currently, the overall MA system is converging, indicating that a directional decision is imminent.
In terms of Fibonacci retracement, after falling from the previous high of $119-$120, the 0.236 level, around $93-$95, is a key support. If the lower Bollinger Band and the MA50 support fail and break down further, it may look towards a deeper retracement range corresponding to the 0.382 level (around $85-$90).
In terms of indicators, the RSI is fluctuating in the neutral-to-weak range of 45-50, not yet entering the oversold zone (<30), indicating that downward momentum exists but has not reached an extreme. Close observation is needed to see if a bullish divergence forms near the lower Bollinger Band and the 50-day moving average (where the price makes a new low while the RSI rises simultaneously), which would be a potential bullish reversal signal. Regarding the MACD indicator, the histogram is close to the zero line, the DIFF and DEA lines are intertwined, and momentum continues to weaken, awaiting a golden cross or death cross signal to confirm the subsequent direction. In terms of volume and volatility, buying has gradually entered the market during the consolidation (especially near the lower Bollinger Band), but there is a lack of sustained volume growth. Tonight's sharp drop was accompanied by a temporary increase in volume. The ATR (Average True Range) continues to narrow, a typical characteristic of the end of a triangle pattern, indicating that a breakout is often accompanied by a sharp expansion of volatility. The Bollinger Bands are also narrowing, further confirming the expectation of higher volatility following low volatility.
Furthermore, the current price of US crude oil is operating within a descending channel extending from the high of 119.48. With the upper rail (descending trend line) of the channel providing continuous resistance, the downside risk of the price in the short term outweighs the upside opportunity, and the overall probability of a decline is higher than that of an increase.
Fundamental analysis
The current geopolitical conflict surrounding Iran remains the core driver of the oil market. Combined with the latest news tonight, the market has a clear expectation that a peace agreement is imminent. Meanwhile, Israeli Prime Minister Netanyahu and US President Trump held a "long and dramatic" phone call early this morning. Netanyahu was emotional and expressed dissatisfaction during the call, highlighting the differences between the two sides on issues related to Iran, directly impacting market confidence in the implementation of a peace agreement. Previously, the conflict in the Strait of Hormuz disrupted shipping, limiting Middle Eastern oil exports and creating a global supply gap, pushing oil prices higher earlier. Tonight's latest geopolitical developments are rewriting market pricing logic.
The market's current focus is on tonight's latest geopolitical developments. The expectation of a peace agreement being signed is intertwined with disagreements arising from the phone call between the US and Israeli leaders. Netanyahu's discontent suggests that the peace agreement's implementation may be subject to change, and no clear directional outcome has been reached. On the supply side, non-OPEC+ oil production remains stable, while OPEC+ production is significantly affected by current geopolitical developments. Key variables include the progress of the peace agreement signing, the navigation situation in the Strait of Hormuz, and the pace of Iranian production recovery—as peace expectations rise, navigation in the Strait of Hormuz has recently rebounded significantly, further impacting short-term supply expectations.
Overall demand is showing moderate growth, but high oil prices and a slowdown in global economic recovery are suppressing crude oil consumption and cannot support a sustained rise in oil prices on their own. Short-term market pricing is entirely driven by the latest geopolitical news tonight, with the interplay between expectations of a peace agreement and disagreements arising from the phone call between US and Israeli leaders directly dominating fluctuations in geopolitical risk premiums. The medium- to long-term trend depends on whether the peace agreement can be successfully implemented and the ultimate outcome of the situation in Iran.
Trading Practice Strategies
Trading is centered on technical breakout signals, while also filtering fundamental news and prioritizing strict risk management. In the short term, focus is on the MA50 (US$97-100). If the price breaks below this support level, a small short position can be initiated, targeting US$93.95, with a stop-loss set above the lower trendline of the triangle pattern.
If the price breaks through the upper trendline of the triangle pattern and the $105-$106 resistance zone with significant volume, long positions can be initiated, managing risk based on the converted support level. Strict position sizing is crucial, along with filtering signals using real-time Middle East geopolitical news and dynamically adjusting stop-loss orders using ATR or volatility indicators to mitigate the risk of gaps caused by sudden news events.
Risk Warning
The crude oil market is highly sensitive to geopolitical developments in Iran, and sudden news can easily trigger price gaps. In trading, it is essential to closely monitor EIA/IEA inventory reports, OPEC activities, and developments in the Middle East. Technical breakout signals must resonate with fundamental news to enhance trading effectiveness.
From a technical perspective, WTI crude oil is currently still trading at the end of a symmetrical triangle consolidation on the daily chart. The window for a technical breakout is narrowing further. The fundamentals are primarily driven by geopolitical tensions with Iran, and the market's balance between bulls and bears has been disrupted by the recent sharp drop.
Technical Analysis
Observing the daily chart, WTI crude oil is still showing a typical symmetrical triangle consolidation pattern. This pattern was formed after the pullback from the previous high (around $119-$120). The upper boundary is the downtrend line, and the lower boundary is the uptrend line. The lower boundary coincides with the key moving average. The price oscillates repeatedly between the two trend lines, and the volatility is gradually narrowing. This pattern is highly consistent with the current dual expectations of "peace vs. war" in the Iranian situation.
(WTI crude oil daily chart source: FX678)
Given tonight's sharp drop, oil prices have quickly fallen to the lower trendline of the triangle pattern and near key moving averages. Currently, it is in a critical testing phase at the end of the pattern. Trading volume has increased in stages along with the sharp drop, breaking the previous pattern of consolidation and shrinkage, which is consistent with the volume characteristics before a breakout at the end of the triangle pattern.
Regarding the moving average system, the price, affected by tonight's sharp drop, is testing the 50-day moving average (MA50, approximately 97.98). This level also serves as a crucial support level for the lower trendline of the triangle pattern. If it holds effectively, the consolidation-biased bullish trend can be maintained; however, a decisive break below this level would confirm a downward breakout, opening up further downside potential. The MA20 provides short-term resistance, while the MA100/MA200 forms multiple resistance and long-term support levels at mid-to-high levels. Currently, the overall MA system is converging, indicating that a directional decision is imminent.
In terms of Fibonacci retracement, after falling from the previous high of $119-$120, the 0.236 level, around $93-$95, is a key support. If the lower Bollinger Band and the MA50 support fail and break down further, it may look towards a deeper retracement range corresponding to the 0.382 level (around $85-$90).
In terms of indicators, the RSI is fluctuating in the neutral-to-weak range of 45-50, not yet entering the oversold zone (<30), indicating that downward momentum exists but has not reached an extreme. Close observation is needed to see if a bullish divergence forms near the lower Bollinger Band and the 50-day moving average (where the price makes a new low while the RSI rises simultaneously), which would be a potential bullish reversal signal. Regarding the MACD indicator, the histogram is close to the zero line, the DIFF and DEA lines are intertwined, and momentum continues to weaken, awaiting a golden cross or death cross signal to confirm the subsequent direction. In terms of volume and volatility, buying has gradually entered the market during the consolidation (especially near the lower Bollinger Band), but there is a lack of sustained volume growth. Tonight's sharp drop was accompanied by a temporary increase in volume. The ATR (Average True Range) continues to narrow, a typical characteristic of the end of a triangle pattern, indicating that a breakout is often accompanied by a sharp expansion of volatility. The Bollinger Bands are also narrowing, further confirming the expectation of higher volatility following low volatility.
Furthermore, the current price of US crude oil is operating within a descending channel extending from the high of 119.48. With the upper rail (descending trend line) of the channel providing continuous resistance, the downside risk of the price in the short term outweighs the upside opportunity, and the overall probability of a decline is higher than that of an increase.
Fundamental analysis
The current geopolitical conflict surrounding Iran remains the core driver of the oil market. Combined with the latest news tonight, the market has a clear expectation that a peace agreement is imminent. Meanwhile, Israeli Prime Minister Netanyahu and US President Trump held a "long and dramatic" phone call early this morning. Netanyahu was emotional and expressed dissatisfaction during the call, highlighting the differences between the two sides on issues related to Iran, directly impacting market confidence in the implementation of a peace agreement. Previously, the conflict in the Strait of Hormuz disrupted shipping, limiting Middle Eastern oil exports and creating a global supply gap, pushing oil prices higher earlier. Tonight's latest geopolitical developments are rewriting market pricing logic.
The market's current focus is on tonight's latest geopolitical developments. The expectation of a peace agreement being signed is intertwined with disagreements arising from the phone call between the US and Israeli leaders. Netanyahu's discontent suggests that the peace agreement's implementation may be subject to change, and no clear directional outcome has been reached. On the supply side, non-OPEC+ oil production remains stable, while OPEC+ production is significantly affected by current geopolitical developments. Key variables include the progress of the peace agreement signing, the navigation situation in the Strait of Hormuz, and the pace of Iranian production recovery—as peace expectations rise, navigation in the Strait of Hormuz has recently rebounded significantly, further impacting short-term supply expectations.
Overall demand is showing moderate growth, but high oil prices and a slowdown in global economic recovery are suppressing crude oil consumption and cannot support a sustained rise in oil prices on their own. Short-term market pricing is entirely driven by the latest geopolitical news tonight, with the interplay between expectations of a peace agreement and disagreements arising from the phone call between US and Israeli leaders directly dominating fluctuations in geopolitical risk premiums. The medium- to long-term trend depends on whether the peace agreement can be successfully implemented and the ultimate outcome of the situation in Iran.
Trading Practice Strategies
Trading is centered on technical breakout signals, while also filtering fundamental news and prioritizing strict risk management. In the short term, focus is on the MA50 (US$97-100). If the price breaks below this support level, a small short position can be initiated, targeting US$93.95, with a stop-loss set above the lower trendline of the triangle pattern.
If the price breaks through the upper trendline of the triangle pattern and the $105-$106 resistance zone with significant volume, long positions can be initiated, managing risk based on the converted support level. Strict position sizing is crucial, along with filtering signals using real-time Middle East geopolitical news and dynamically adjusting stop-loss orders using ATR or volatility indicators to mitigate the risk of gaps caused by sudden news events.
Risk Warning
The crude oil market is highly sensitive to geopolitical developments in Iran, and sudden news can easily trigger price gaps. In trading, it is essential to closely monitor EIA/IEA inventory reports, OPEC activities, and developments in the Middle East. Technical breakout signals must resonate with fundamental news to enhance trading effectiveness.
- Risk Warning and Disclaimer
- The market involves risk, and trading may not be suitable for all investors. This article is for reference only and does not constitute personal investment advice, nor does it take into account certain users’ specific investment objectives, financial situation, or other needs. Any investment decisions made based on this information are at your own risk.