Silver Market Forecast: Uncertainty surrounding the Fed's policy outlook leads to a defensive stance in the silver market.
2026-05-21 19:27:36
On Thursday (May 21), during the European session, spot silver was quoted at $74.833 per ounce, down $0.986 on the day, a decrease of 1.3%; the cumulative decline for the week widened to 1.35%, with silver prices trading between $73.068 and $78.865 this week.
The overall market structure remains unchanged: US Treasury yields remain high, and the US dollar index is strong. Silver itself has no interest-bearing properties, a characteristic that continues to be a key consideration for investors in the current market environment, leading to repeated negative sentiment.
Technical Analysis
From the perspective of the daily chart's volatility structure, spot silver is still in an overall upward trend, but the short-term upward momentum has already weakened.
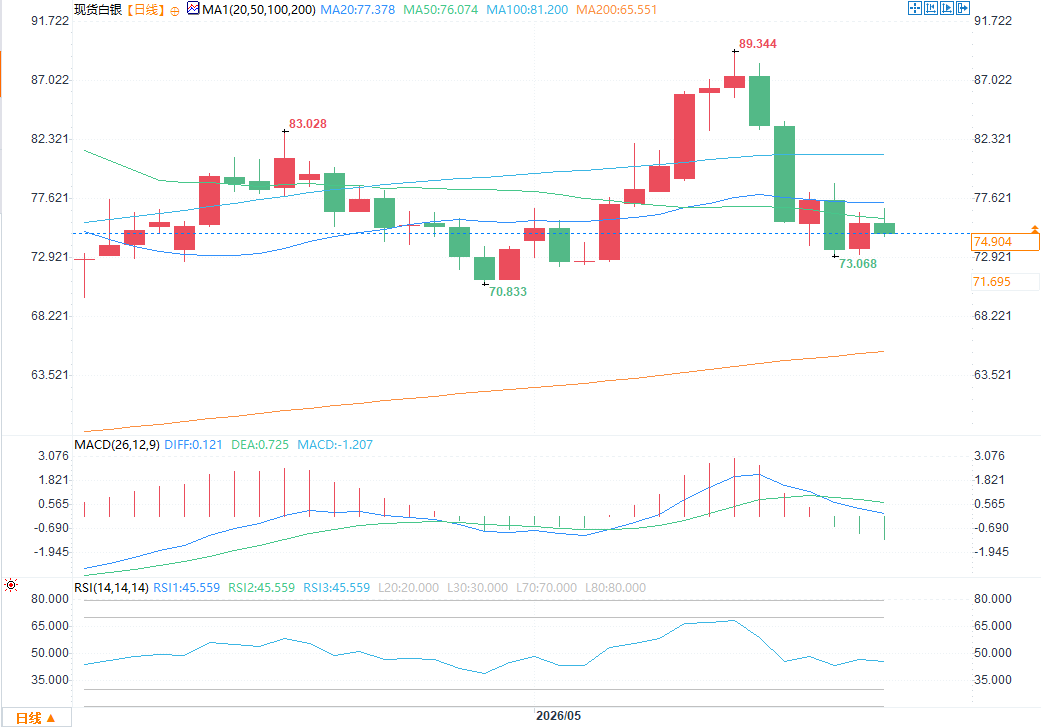
(Spot silver daily chart source: EasyTrade)
Key Breakout: A decisive break below $70.86 in silver prices would directly reverse the overall trend and turn it downward.
Trend confirmed: Only a firm break above $89.38 would solidify the bullish uptrend.
Short-term trading range: $70.86 - $89.38, with pullback resistance levels at $81.24 - $83.16, which represent potential upside targets for silver prices.
The medium-term trading range is defined as $61.00 to $89.38. Currently, silver prices are testing the medium-term retracement support range of $71.84 to $75.19.
The long-term range is from $45.55 to $121.67. Over the past four months, silver prices have been fluctuating within the long-term retracement range of $74.63 to $83.61.
In the past three trading days, silver prices have been fluctuating narrowly within a price range formed by the long-term 61.8% Fibonacci retracement level of $74.63 and the medium-term 50% Fibonacci retracement level of $75.19.
The moving average system also exhibits a range-bound trading pattern: since February of this year, the 50-day moving average at $76.11 has consistently acted as strong resistance, while the 200-day moving average at $65.61 has formed solid long-term support. Previously, silver prices attempted to break through the 50-day moving average multiple times, but although they briefly surged, they were unable to sustain the upward momentum and ultimately fell back below the moving average.
The 200-day moving average dominates the long-term trend of silver, and the market still leans slightly bullish in the long term; however, the silver price has consistently failed to hold above the 50-day moving average, indicating extremely weak upward momentum. Furthermore, the current silver price is at the lower edge of a long-term retracement range, directly reflecting a severe lack of buying power in the market.
Currently, the 50-day moving average and the 200-day moving average are about to cross. Based on the current market trend, there is a potential risk that silver prices will accelerate their decline in the future.
Intraday price movements are primarily determined by the market's attitude towards the 50-day moving average:
Silver prices have continued to hold above the 50-day moving average and are expected to test the $81.24-$83.61 range, where selling pressure is likely to intensify again.
Silver prices have decisively broken below the 50-day moving average, indicating that bears have gained the upper hand in the market; however, a deep decline is unlikely to begin until the key level of $70.86 is breached. Most bullish funds are currently observing and waiting for silver prices to pull back and test the 200-day moving average support before entering the market.
Overall market analysis: In the short term, silver will maintain a fluctuating trend with back-and-forth battles between bulls and bears.
US Treasury yields become the core negative factor.
The persistently high yield on 10-year US Treasury bonds is the most fundamental factor suppressing the price of spot silver. Silver does not generate any interest income, while US Treasury bonds offer low-risk, stable returns. This stark contrast significantly reduces the cost-effectiveness of allocating funds to silver.
A large amount of trading funds that bet on a Federal Reserve rate cut at the beginning of the year have been gradually closed out in recent weeks, and the silver market continues to bear this selling pressure.
The positive logic of interest rate cuts that supported the rise in precious metals in the first quarter has completely failed. Currently, persistently high inflation data, coupled with the Federal Reserve's reluctance to release clear easing signals, has completely reversed the market's fundamental outlook. Before monetary policy shifts to easing, every rebound in silver prices has been met with negative policy pressures.
A stronger US dollar creates a second layer of pressure.
The continued strengthening of the US dollar index has further exacerbated the downward pressure on silver. Since silver is priced globally in US dollars, the appreciation of the dollar has significantly increased the cost for non-US buyers to purchase silver, leading to a gradual contraction in overseas physical and investment demand. The continued strengthening of the dollar will further accelerate the cooling of demand.
The combination of high US Treasury yields and a strong US dollar is a double whammy, which is completely unfavorable for the rise of non-yielding precious metal assets. The weak performance of silver prices this week perfectly confirms this market logic.
The core triggering conditions for a market reversal
A shift in expectations regarding the Federal Reserve's monetary policy is the only key to breaking the current weakness in silver prices. Once US inflation data declines and economic growth shows signs of weakness, market expectations for interest rate cuts will rise again, directly opening up upward potential for silver prices.
Currently, long positions in the silver market have been significantly reduced, and retail investors with weak positions have basically exited the market. As long as there is a substantial positive catalyst, funds that were waiting on the sidelines will quickly flow back into the market and push up silver prices.
Before any major positive news materializes, the current macroeconomic environment is generally bearish: persistently high inflation, firm US Treasury yields, and a strong US dollar are the three major negative factors working together. Without a data-driven turnaround, it will be difficult for the market to see a turnaround.
Focus on key observation indicators
Inflation-related data and official statements from the Federal Reserve are the fundamental factors that determine whether silver will bottom out and stabilize or continue to fall.
From a technical perspective, pay close attention to the 50-day moving average on the daily chart at $76.11, a key level.
If it holds above this price level, the upside target is the resistance zone of $81.24 to $83.61.
If this price level is broken, the downside will first test the support zone of $71.84 to $75.19, and if it is breached, the next target will be the trend turning point of $70.86.
The ultimate strong long-term support level is locked at the 200-day moving average of $65.61.
As long as the Fed's monetary policy expectations remain unchanged and the dollar does not show a significant decline, silver is likely to continue to maintain a wide range of fluctuations and a tug-of-war between bulls and bears.
The overall market structure remains unchanged: US Treasury yields remain high, and the US dollar index is strong. Silver itself has no interest-bearing properties, a characteristic that continues to be a key consideration for investors in the current market environment, leading to repeated negative sentiment.
Technical Analysis
From the perspective of the daily chart's volatility structure, spot silver is still in an overall upward trend, but the short-term upward momentum has already weakened.
(Spot silver daily chart source: EasyTrade)
Key Breakout: A decisive break below $70.86 in silver prices would directly reverse the overall trend and turn it downward.
Trend confirmed: Only a firm break above $89.38 would solidify the bullish uptrend.
Short-term trading range: $70.86 - $89.38, with pullback resistance levels at $81.24 - $83.16, which represent potential upside targets for silver prices.
The medium-term trading range is defined as $61.00 to $89.38. Currently, silver prices are testing the medium-term retracement support range of $71.84 to $75.19.
The long-term range is from $45.55 to $121.67. Over the past four months, silver prices have been fluctuating within the long-term retracement range of $74.63 to $83.61.
In the past three trading days, silver prices have been fluctuating narrowly within a price range formed by the long-term 61.8% Fibonacci retracement level of $74.63 and the medium-term 50% Fibonacci retracement level of $75.19.
The moving average system also exhibits a range-bound trading pattern: since February of this year, the 50-day moving average at $76.11 has consistently acted as strong resistance, while the 200-day moving average at $65.61 has formed solid long-term support. Previously, silver prices attempted to break through the 50-day moving average multiple times, but although they briefly surged, they were unable to sustain the upward momentum and ultimately fell back below the moving average.
The 200-day moving average dominates the long-term trend of silver, and the market still leans slightly bullish in the long term; however, the silver price has consistently failed to hold above the 50-day moving average, indicating extremely weak upward momentum. Furthermore, the current silver price is at the lower edge of a long-term retracement range, directly reflecting a severe lack of buying power in the market.
Currently, the 50-day moving average and the 200-day moving average are about to cross. Based on the current market trend, there is a potential risk that silver prices will accelerate their decline in the future.
Intraday price movements are primarily determined by the market's attitude towards the 50-day moving average:
Silver prices have continued to hold above the 50-day moving average and are expected to test the $81.24-$83.61 range, where selling pressure is likely to intensify again.
Silver prices have decisively broken below the 50-day moving average, indicating that bears have gained the upper hand in the market; however, a deep decline is unlikely to begin until the key level of $70.86 is breached. Most bullish funds are currently observing and waiting for silver prices to pull back and test the 200-day moving average support before entering the market.
Overall market analysis: In the short term, silver will maintain a fluctuating trend with back-and-forth battles between bulls and bears.
US Treasury yields become the core negative factor.
The persistently high yield on 10-year US Treasury bonds is the most fundamental factor suppressing the price of spot silver. Silver does not generate any interest income, while US Treasury bonds offer low-risk, stable returns. This stark contrast significantly reduces the cost-effectiveness of allocating funds to silver.
A large amount of trading funds that bet on a Federal Reserve rate cut at the beginning of the year have been gradually closed out in recent weeks, and the silver market continues to bear this selling pressure.
The positive logic of interest rate cuts that supported the rise in precious metals in the first quarter has completely failed. Currently, persistently high inflation data, coupled with the Federal Reserve's reluctance to release clear easing signals, has completely reversed the market's fundamental outlook. Before monetary policy shifts to easing, every rebound in silver prices has been met with negative policy pressures.
A stronger US dollar creates a second layer of pressure.
The continued strengthening of the US dollar index has further exacerbated the downward pressure on silver. Since silver is priced globally in US dollars, the appreciation of the dollar has significantly increased the cost for non-US buyers to purchase silver, leading to a gradual contraction in overseas physical and investment demand. The continued strengthening of the dollar will further accelerate the cooling of demand.
The combination of high US Treasury yields and a strong US dollar is a double whammy, which is completely unfavorable for the rise of non-yielding precious metal assets. The weak performance of silver prices this week perfectly confirms this market logic.
The core triggering conditions for a market reversal
A shift in expectations regarding the Federal Reserve's monetary policy is the only key to breaking the current weakness in silver prices. Once US inflation data declines and economic growth shows signs of weakness, market expectations for interest rate cuts will rise again, directly opening up upward potential for silver prices.
Currently, long positions in the silver market have been significantly reduced, and retail investors with weak positions have basically exited the market. As long as there is a substantial positive catalyst, funds that were waiting on the sidelines will quickly flow back into the market and push up silver prices.
Before any major positive news materializes, the current macroeconomic environment is generally bearish: persistently high inflation, firm US Treasury yields, and a strong US dollar are the three major negative factors working together. Without a data-driven turnaround, it will be difficult for the market to see a turnaround.
Focus on key observation indicators
Inflation-related data and official statements from the Federal Reserve are the fundamental factors that determine whether silver will bottom out and stabilize or continue to fall.
From a technical perspective, pay close attention to the 50-day moving average on the daily chart at $76.11, a key level.
If it holds above this price level, the upside target is the resistance zone of $81.24 to $83.61.
If this price level is broken, the downside will first test the support zone of $71.84 to $75.19, and if it is breached, the next target will be the trend turning point of $70.86.
The ultimate strong long-term support level is locked at the 200-day moving average of $65.61.
As long as the Fed's monetary policy expectations remain unchanged and the dollar does not show a significant decline, silver is likely to continue to maintain a wide range of fluctuations and a tug-of-war between bulls and bears.
- Risk Warning and Disclaimer
- The market involves risk, and trading may not be suitable for all investors. This article is for reference only and does not constitute personal investment advice, nor does it take into account certain users’ specific investment objectives, financial situation, or other needs. Any investment decisions made based on this information are at your own risk.