Gold Analysis: From 4889 to 4453 and then back to 4570, is this "escape from death" a sign of dawn or an even bigger trap?
2026-05-25 20:03:46
On Monday, May 25th, spot gold fluctuated around $4570 per ounce, rebounding from last week's lows but still not breaking free from the range-bound resistance. During the same period, Brent crude oil fell to approximately $97.50 per barrel, a single-day drop of over 5%, and the US dollar index retreated to approximately 98.95. The simultaneous weakening of oil prices and the dollar became the direct macroeconomic backdrop for gold's rebound that day.
The current surge in spot gold prices appears to have occurred amid rising expectations of a temporary truce between the US and Iran, and the logic behind this is not contradictory. If the conflict de-escalates, the traditional safe-haven premium will weaken, but a rapid decline in oil prices will simultaneously reduce tail risks of inflation, thereby diminishing the need for the Federal Reserve to maintain a tight stance. For gold, which does not generate interest, a decline in expected real interest rates is often more price-elastic than simple safe-haven sentiment.
Currently, the market is truly trading on the chain between oil prices, inflation, interest rates, and the US dollar. In recent weeks, high energy prices have put pressure on gold, not primarily because gold has lost its safe-haven appeal, but because rising inflation expectations have led to increased expectations of rising interest rates, suppressing the valuation of non-interest-bearing assets. Now that oil prices have fallen below $100 per barrel, traders are reassessing the pressure of inflation transmission, thus providing room for gold to recover.
Current market expectations are focused on extending the ceasefire, allowing passage through the Strait of Hormuz, and phased arrangements. Public reports indicate that Washington and Tehran are close to reaching a broad framework, but disagreements remain on several terms, particularly regarding shipping passage, the pace of asset unfreezing, and subsequent nuclear-related arrangements.
This means that gold has not entered a one-sided risk-relief mode. For traders, a more accurate description is that the risk premium has shifted from rapid expansion to a re-stratification. Falling oil prices have released inflationary pressures, which is beneficial to gold valuations; however, if the details of the agreement are repeatedly debated, energy supply risks may re-enter the pricing, at which point gold may simultaneously face the pull of a return of safe-haven buying and a renewed rise in interest rate expectations.
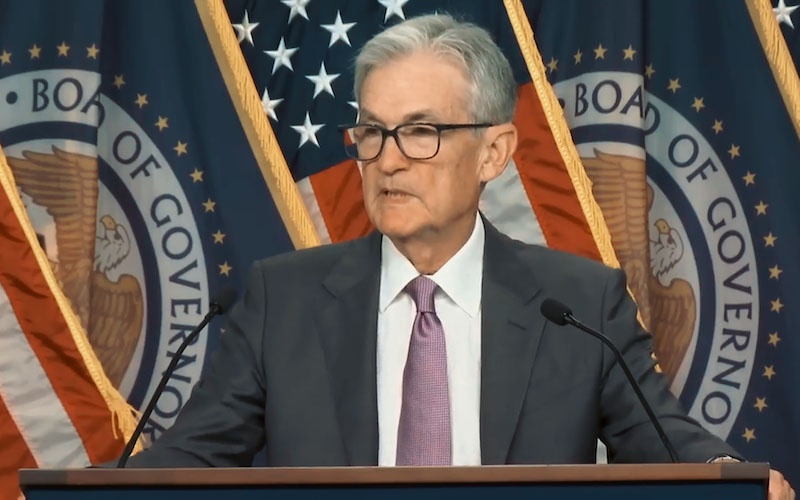
According to official information from the Federal Reserve, Warsh assumed the position of Chairman of the Federal Reserve on May 22, and will also serve as Chairman of the Federal Open Market Committee, with his term ending in May 2030. In the initial period after a new chairman takes office, the market typically recalibrates its response functions to inflation, financial conditions, and policy communication.
This isn't a simple bullish or bearish factor for gold, but rather a volatility factor. If oil prices continue to decline, the market will reduce the probability of interest rate hikes, supporting gold's valuation. However, if inflation remains sticky after energy prices fall, the Federal Reserve may maintain a cautious stance, and the downward pressure on gold from real interest rates will be difficult to remove quickly. In other words, the quality of gold's short-term rebound ultimately depends on whether the decline in oil prices can translate into a more stable downward revision of interest rate expectations.
From the daily chart, spot gold is currently trading at around $4,570 per ounce, still below the Bollinger Band middle line at $4,632.88 per ounce; the upper band is at $4,811.53 per ounce, and the lower band is at $4,454.24 per ounce. The price previously retreated from a high of $4,889.24 per ounce, then formed a secondary high at $4,773.37 per ounce, with recent lows reaching around $4,453.60 per ounce.
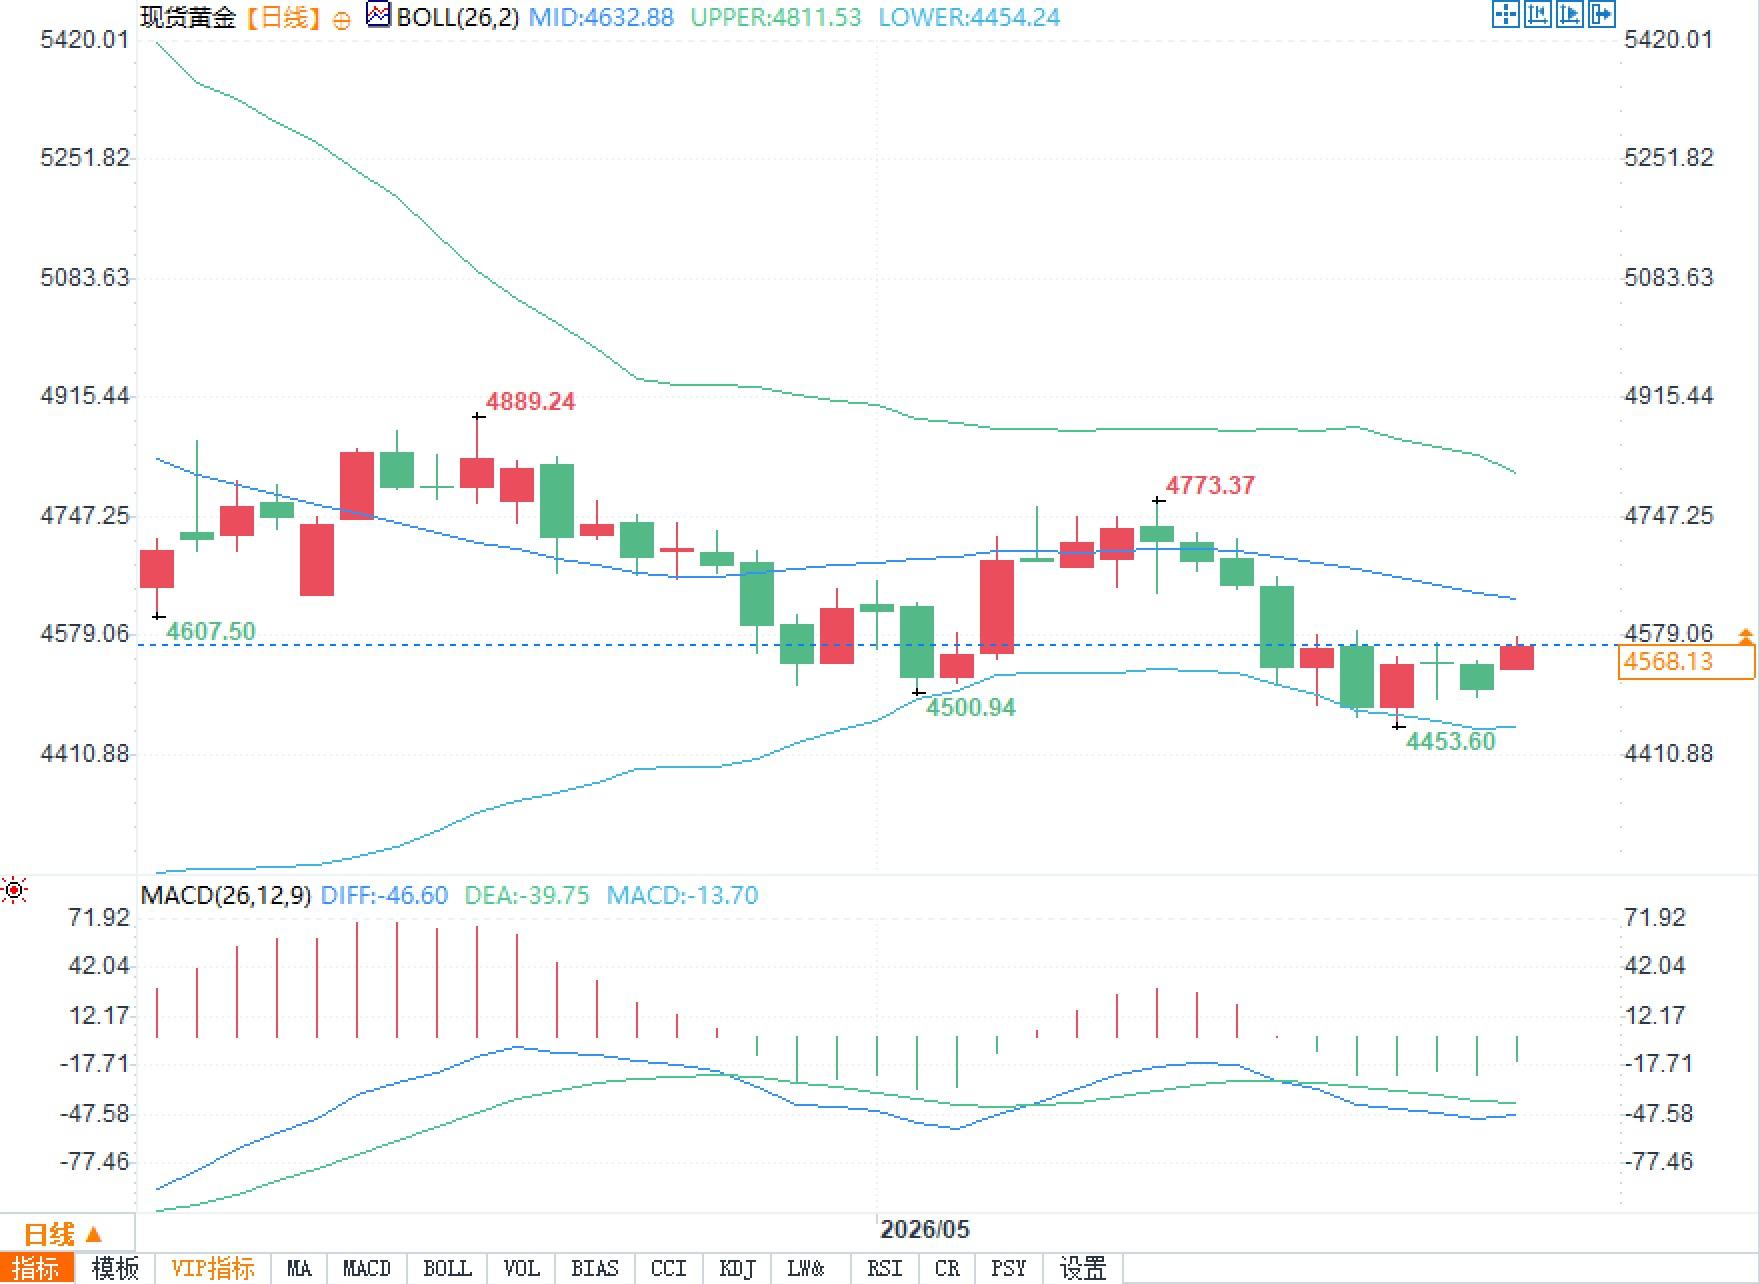
In terms of MACD, the DIFF is -46.60, the DEA is -39.75, and the histogram is -13.70, indicating that although momentum shows signs of convergence, a strong recovery has not yet been completed at the daily level. The current gold price has rebounded above the lower Bollinger Band, reflecting more of a mean reversion after an oversold condition. If it cannot approach and stabilize above the middle Bollinger Band resistance, the market remains in a recovery phase after wide-range fluctuations, rather than a trend reversal.
Question 1: Why did the easing of the conflict push up gold prices?
A: The core issue is not increased risk aversion, but rather that the decline in oil prices has weakened inflationary pressures, the market is reassessing the necessity for the Federal Reserve to maintain a tight stance, the dollar and real interest rate expectations are weakening in tandem, and gold is experiencing valuation repair.
Question 2: Has gold broken free from its weakness?
A: It's too early to draw conclusions. The daily price is still below the Bollinger Middle Band, and the MACD is still in negative territory. The rebound is more like a correction starting from near the lower band.
Question 3: What is the largest variable going forward?
A: The variables are concentrated on the passage through the Strait of Hormuz, the details of the temporary arrangements, whether oil prices can stabilize and fall, and the new Federal Reserve Chairman's policy statement on inflation risks.
The key to the gold rebound is not safe-haven demand, but rather the repricing of the interest rate path.
The current surge in spot gold prices appears to have occurred amid rising expectations of a temporary truce between the US and Iran, and the logic behind this is not contradictory. If the conflict de-escalates, the traditional safe-haven premium will weaken, but a rapid decline in oil prices will simultaneously reduce tail risks of inflation, thereby diminishing the need for the Federal Reserve to maintain a tight stance. For gold, which does not generate interest, a decline in expected real interest rates is often more price-elastic than simple safe-haven sentiment.
Currently, the market is truly trading on the chain between oil prices, inflation, interest rates, and the US dollar. In recent weeks, high energy prices have put pressure on gold, not primarily because gold has lost its safe-haven appeal, but because rising inflation expectations have led to increased expectations of rising interest rates, suppressing the valuation of non-interest-bearing assets. Now that oil prices have fallen below $100 per barrel, traders are reassessing the pressure of inflation transmission, thus providing room for gold to recover.
There are still gaps in the US-Iran negotiations, and the risk premium will not disappear linearly.
Current market expectations are focused on extending the ceasefire, allowing passage through the Strait of Hormuz, and phased arrangements. Public reports indicate that Washington and Tehran are close to reaching a broad framework, but disagreements remain on several terms, particularly regarding shipping passage, the pace of asset unfreezing, and subsequent nuclear-related arrangements.
This means that gold has not entered a one-sided risk-relief mode. For traders, a more accurate description is that the risk premium has shifted from rapid expansion to a re-stratification. Falling oil prices have released inflationary pressures, which is beneficial to gold valuations; however, if the details of the agreement are repeatedly debated, energy supply risks may re-enter the pricing, at which point gold may simultaneously face the pull of a return of safe-haven buying and a renewed rise in interest rate expectations.
The change of leadership at the Federal Reserve has made policy readings more difficult.
According to official information from the Federal Reserve, Warsh assumed the position of Chairman of the Federal Reserve on May 22, and will also serve as Chairman of the Federal Open Market Committee, with his term ending in May 2030. In the initial period after a new chairman takes office, the market typically recalibrates its response functions to inflation, financial conditions, and policy communication.
This isn't a simple bullish or bearish factor for gold, but rather a volatility factor. If oil prices continue to decline, the market will reduce the probability of interest rate hikes, supporting gold's valuation. However, if inflation remains sticky after energy prices fall, the Federal Reserve may maintain a cautious stance, and the downward pressure on gold from real interest rates will be difficult to remove quickly. In other words, the quality of gold's short-term rebound ultimately depends on whether the decline in oil prices can translate into a more stable downward revision of interest rate expectations.
Technical analysis suggests the rebound is still in a recovery phase.
From the daily chart, spot gold is currently trading at around $4,570 per ounce, still below the Bollinger Band middle line at $4,632.88 per ounce; the upper band is at $4,811.53 per ounce, and the lower band is at $4,454.24 per ounce. The price previously retreated from a high of $4,889.24 per ounce, then formed a secondary high at $4,773.37 per ounce, with recent lows reaching around $4,453.60 per ounce.
In terms of MACD, the DIFF is -46.60, the DEA is -39.75, and the histogram is -13.70, indicating that although momentum shows signs of convergence, a strong recovery has not yet been completed at the daily level. The current gold price has rebounded above the lower Bollinger Band, reflecting more of a mean reversion after an oversold condition. If it cannot approach and stabilize above the middle Bollinger Band resistance, the market remains in a recovery phase after wide-range fluctuations, rather than a trend reversal.
Frequently Asked Questions
Question 1: Why did the easing of the conflict push up gold prices?
A: The core issue is not increased risk aversion, but rather that the decline in oil prices has weakened inflationary pressures, the market is reassessing the necessity for the Federal Reserve to maintain a tight stance, the dollar and real interest rate expectations are weakening in tandem, and gold is experiencing valuation repair.
Question 2: Has gold broken free from its weakness?
A: It's too early to draw conclusions. The daily price is still below the Bollinger Middle Band, and the MACD is still in negative territory. The rebound is more like a correction starting from near the lower band.
Question 3: What is the largest variable going forward?
A: The variables are concentrated on the passage through the Strait of Hormuz, the details of the temporary arrangements, whether oil prices can stabilize and fall, and the new Federal Reserve Chairman's policy statement on inflation risks.
- Risk Warning and Disclaimer
- The market involves risk, and trading may not be suitable for all investors. This article is for reference only and does not constitute personal investment advice, nor does it take into account certain users’ specific investment objectives, financial situation, or other needs. Any investment decisions made based on this information are at your own risk.