A sharp drop in oil prices coupled with weaker core PCE data may boost gold prices.
2026-05-26 19:43:09
On Tuesday (May 26), spot gold (XAUUSD) was quoted at $4,520.06 per ounce during the European session, down 1.11%. The daily chart shows a sharp drop due to the rebound in oil prices and the rise in the US dollar and US Treasury yields, which is a technical correction driven by short-term sentiment; however, the weekly chart still shows a slight increase, and the price is firmly above the medium-term moving average, indicating that the medium-term upward trend has not been broken.

Oil price fluctuations have far-reaching effects.
The weekly chart for West Texas Intermediate (WTI) crude oil for July delivery shows a sharp drop in prices, falling to the $90-$93 range. Brent crude oil saw a similar decline, falling back to around $96-$99. Such significant volatility in the energy market will not be limited to the oil market itself, but will spread to the entire financial market.
Lower crude oil prices will gradually reduce transportation and fuel costs in the coming months, easing upward pressure on prices. Gold traders are closely watching oil prices not because of the supply and demand of crude oil itself, but because crude oil is the most direct factor affecting inflation. The current market logic is very clear: lower oil prices → easing inflationary pressures → reduced need for the Federal Reserve to tighten policy → lower US Treasury yields → weaker US dollar index. With each link in the chain, spot gold prices have upward momentum.
Core PCE data: a key indicator this week
The Personal Consumption Expenditures (PCE) price index is the most important economic data this week. The market currently expects a year-on-year increase of 3.2% and a month-on-month increase of approximately 0.3%. If the final figure is flat or below 3.2%, especially if the month-on-month figure falls back to around 0.2%, the market will confirm that an inflation inflection point has emerged.
A sharp drop in oil prices coupled with weaker PCE data will create a powerful confluence of signals. With US Treasury yields and the US dollar index declining in tandem, previously hesitant funds will likely enter the market to buy gold.
Conversely, if the core PCE data unexpectedly rises to 3.3% or higher, market expectations for a Fed rate cut will immediately dissipate. Investors will repric, anticipating that the Fed will maintain its tightening policy, and gold prices will give back this week's short-term gains. This is the main risk currently facing the market and cannot be ignored.
GDP data: the second test
The US GDP grew at an annualized rate of 2.0% in the last quarter, and the latest data released this week will further increase the uncertainty surrounding gold's price movement. High economic growth is unfavorable for gold prices: if GDP growth exceeds expectations, the market will believe that the US economy can withstand a high-interest-rate environment, and the Federal Reserve has no reason to ease monetary policy. Against this backdrop, support for US Treasury yields and a strong dollar will both suppress gold prices.
If GDP growth falls to 1.5%–1.7% or even lower, market sentiment will completely shift. An economic slowdown coupled with falling oil prices will reinforce market expectations of an economic slowdown and a subsequent shift towards easing by the Federal Reserve. When market expectations adjust rapidly, gold prices often experience rapid price movements—a shift in policy expectations from "maintaining tightening" to "imminent easing" will simultaneously impact yields, the US dollar, and precious metal prices.
The new Federal Reserve chairman brings uncertainty.
The policy stance of newly appointed Federal Reserve Chairman Kevin Warsh remains an unknown factor for the market. Traders have not yet fully grasped his assessment of inflation risks and his policy-making approach, and this uncertainty has led to a reduction in risk appetite across the precious metals sector. While this factor will not dominate the direction of gold prices, it will continue to influence market sentiment, with both bulls and bears remaining cautious and awaiting clearer policy signals.
Spot Gold Weekly Technical Analysis
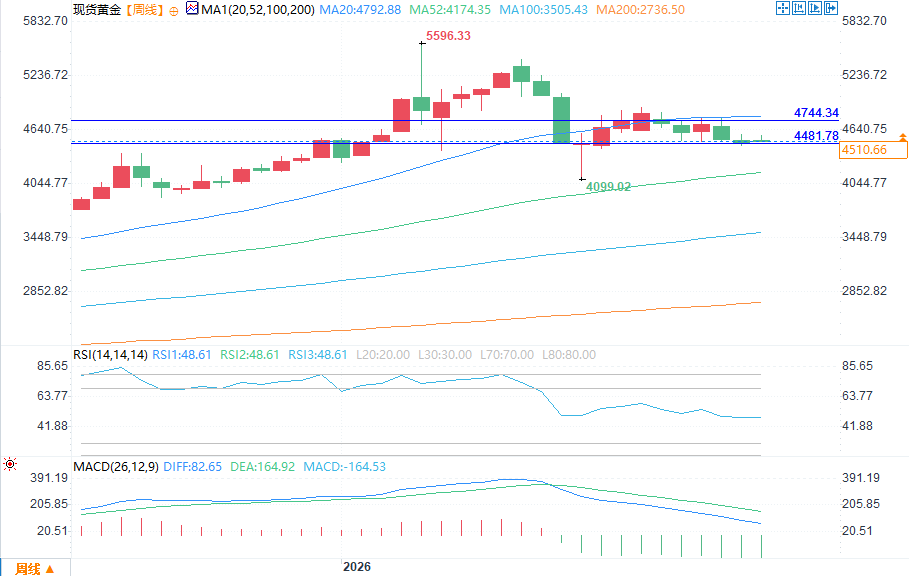
(Spot gold weekly chart source: FX678)
From the weekly trend indicators, gold is currently in a downtrend. If the price breaks through $4891.54, the trend will reverse from falling to rising; if it falls below $4099.12 again, the downtrend will be confirmed to continue.
In the long term, the 52-week moving average at $4,175.63 provides support for gold prices.
Gold prices have been trading within a range of $3,886.46 to $5,602.23 for the long term. For the past nine weeks, gold prices have fluctuated within a retracement range of $4,744.34 to $4,541.88.
The medium-term range is $5602.23 to $4099.12, with corresponding retracement resistance at $4850.68–$5028.04. Seven weeks ago, gold prices encountered resistance and fell back at this range when they rose to $4891.54.
The short-term range is between $4,099.12 and $4,891.54, with a pullback support range of $4,495.33 to $4,401.82, where the decline stopped when gold prices fell to $4,453.39 last week.
$5602.23 is the all-time high for gold. A 20% drop from that high corresponds to $4481.78, a key dividing line between bull and bear markets. Gold prices briefly fell below this level in mid-March, but bulls have consistently supported the price around this level since then.
This week's gold price movement will largely depend on the market's reaction to the long-term 61.8% Fibonacci retracement level at $4541.88. If gold prices hold above this level, the next target is $4744.34; if they continue to fall below it, it means that selling pressure is in control and buying power is insufficient, and gold prices may gradually test $4495.33, $4481.78, and $4402.82. Below $4402.82, only the 52-week moving average at $4175.77 remains as the last important support level.
Market Outlook This Week
Currently, the sharp drop in oil prices is the core driver of the gold price rebound. If PCE data confirms continued cooling inflation and GDP data confirms a slowdown in economic growth, the three signals of inflation, growth, and oil prices will collectively point to a decline in US Treasury yields and a weakening dollar, attracting significant buying interest in gold. Conversely, if inflation data is high or economic growth exceeds expectations, the current positive logic will completely fail, and market dominance will revert to the hands of the bears.
The 61.8% Fibonacci retracement level of $4541.88 is the key level to determine whether gold is bullish or bearish this week. Holding above this level could see gold prices challenge $4744.34; a break below this level would target $4495.33, $4481.78, and $4401.82, ultimately settling on the crucial 52-week moving average support at $4175.77.
Oil price fluctuations have far-reaching effects.
The weekly chart for West Texas Intermediate (WTI) crude oil for July delivery shows a sharp drop in prices, falling to the $90-$93 range. Brent crude oil saw a similar decline, falling back to around $96-$99. Such significant volatility in the energy market will not be limited to the oil market itself, but will spread to the entire financial market.
Lower crude oil prices will gradually reduce transportation and fuel costs in the coming months, easing upward pressure on prices. Gold traders are closely watching oil prices not because of the supply and demand of crude oil itself, but because crude oil is the most direct factor affecting inflation. The current market logic is very clear: lower oil prices → easing inflationary pressures → reduced need for the Federal Reserve to tighten policy → lower US Treasury yields → weaker US dollar index. With each link in the chain, spot gold prices have upward momentum.
Core PCE data: a key indicator this week
The Personal Consumption Expenditures (PCE) price index is the most important economic data this week. The market currently expects a year-on-year increase of 3.2% and a month-on-month increase of approximately 0.3%. If the final figure is flat or below 3.2%, especially if the month-on-month figure falls back to around 0.2%, the market will confirm that an inflation inflection point has emerged.
A sharp drop in oil prices coupled with weaker PCE data will create a powerful confluence of signals. With US Treasury yields and the US dollar index declining in tandem, previously hesitant funds will likely enter the market to buy gold.
Conversely, if the core PCE data unexpectedly rises to 3.3% or higher, market expectations for a Fed rate cut will immediately dissipate. Investors will repric, anticipating that the Fed will maintain its tightening policy, and gold prices will give back this week's short-term gains. This is the main risk currently facing the market and cannot be ignored.
GDP data: the second test
The US GDP grew at an annualized rate of 2.0% in the last quarter, and the latest data released this week will further increase the uncertainty surrounding gold's price movement. High economic growth is unfavorable for gold prices: if GDP growth exceeds expectations, the market will believe that the US economy can withstand a high-interest-rate environment, and the Federal Reserve has no reason to ease monetary policy. Against this backdrop, support for US Treasury yields and a strong dollar will both suppress gold prices.
If GDP growth falls to 1.5%–1.7% or even lower, market sentiment will completely shift. An economic slowdown coupled with falling oil prices will reinforce market expectations of an economic slowdown and a subsequent shift towards easing by the Federal Reserve. When market expectations adjust rapidly, gold prices often experience rapid price movements—a shift in policy expectations from "maintaining tightening" to "imminent easing" will simultaneously impact yields, the US dollar, and precious metal prices.
The new Federal Reserve chairman brings uncertainty.
The policy stance of newly appointed Federal Reserve Chairman Kevin Warsh remains an unknown factor for the market. Traders have not yet fully grasped his assessment of inflation risks and his policy-making approach, and this uncertainty has led to a reduction in risk appetite across the precious metals sector. While this factor will not dominate the direction of gold prices, it will continue to influence market sentiment, with both bulls and bears remaining cautious and awaiting clearer policy signals.
Spot Gold Weekly Technical Analysis
(Spot gold weekly chart source: FX678)
From the weekly trend indicators, gold is currently in a downtrend. If the price breaks through $4891.54, the trend will reverse from falling to rising; if it falls below $4099.12 again, the downtrend will be confirmed to continue.
In the long term, the 52-week moving average at $4,175.63 provides support for gold prices.
Gold prices have been trading within a range of $3,886.46 to $5,602.23 for the long term. For the past nine weeks, gold prices have fluctuated within a retracement range of $4,744.34 to $4,541.88.
The medium-term range is $5602.23 to $4099.12, with corresponding retracement resistance at $4850.68–$5028.04. Seven weeks ago, gold prices encountered resistance and fell back at this range when they rose to $4891.54.
The short-term range is between $4,099.12 and $4,891.54, with a pullback support range of $4,495.33 to $4,401.82, where the decline stopped when gold prices fell to $4,453.39 last week.
$5602.23 is the all-time high for gold. A 20% drop from that high corresponds to $4481.78, a key dividing line between bull and bear markets. Gold prices briefly fell below this level in mid-March, but bulls have consistently supported the price around this level since then.
This week's gold price movement will largely depend on the market's reaction to the long-term 61.8% Fibonacci retracement level at $4541.88. If gold prices hold above this level, the next target is $4744.34; if they continue to fall below it, it means that selling pressure is in control and buying power is insufficient, and gold prices may gradually test $4495.33, $4481.78, and $4402.82. Below $4402.82, only the 52-week moving average at $4175.77 remains as the last important support level.
Market Outlook This Week
Currently, the sharp drop in oil prices is the core driver of the gold price rebound. If PCE data confirms continued cooling inflation and GDP data confirms a slowdown in economic growth, the three signals of inflation, growth, and oil prices will collectively point to a decline in US Treasury yields and a weakening dollar, attracting significant buying interest in gold. Conversely, if inflation data is high or economic growth exceeds expectations, the current positive logic will completely fail, and market dominance will revert to the hands of the bears.
The 61.8% Fibonacci retracement level of $4541.88 is the key level to determine whether gold is bullish or bearish this week. Holding above this level could see gold prices challenge $4744.34; a break below this level would target $4495.33, $4481.78, and $4401.82, ultimately settling on the crucial 52-week moving average support at $4175.77.
- Risk Warning and Disclaimer
- The market involves risk, and trading may not be suitable for all investors. This article is for reference only and does not constitute personal investment advice, nor does it take into account certain users’ specific investment objectives, financial situation, or other needs. Any investment decisions made based on this information are at your own risk.