Amid the ongoing US-Iran military conflict, oil prices have plummeted due to "expectations of an agreement"—is the market wrong?
2026-05-27 13:39:20
Despite renewed hostilities between the US and Iran and continued uncertainty surrounding the crucial Strait of Hormuz, market optimism that the US and Iran would reach a peace agreement drove oil prices down.
Brent crude fell more than 4% to around $95 a barrel on Wednesday (May 27), while West Texas Intermediate crude traded below $92.
U.S. Secretary of State Marco Rubio warned that any peace agreement could take several more days to be finalized.

Meanwhile, the U.S. military struck targets near the strait, and Iran's Islamic Revolutionary Guard Corps stated that it fired on several U.S. aircraft after they entered Iranian airspace. The strait, a crucial waterway through which one-fifth of the world's oil and liquefied natural gas flows during peacetime, remains largely closed and is blocked by the U.S. and Iran.
However, at least two non-Iranian supertankers sailed out of this choke point on Tuesday, marking the first time in two weeks that 4 million barrels of unsanctioned crude oil had been observed to pass through.
Observing and forecasting the market, the expected probability of traffic in the Strait of Hormuz returning to normal by the end of June (the issue the market is most concerned about) surged to 70% over the weekend, but has now fallen back to a "coin toss" level of around 50%.
Overall, price action so far this week highlights the market's asymmetric reaction pattern to news from Iran. Traders will continue to be skeptical of established trends until this dynamic changes.
Robert Lenny, head of commodities research at Westpac, said: “The market is trading on the prospect of an Iran deal, but the clean reopening story is still months or even quarters away: the Strait remains technically closed, and a physical reset will take time. Brent crude may dip on the optimism surrounding the deal, but the price drop is likely to be shallow and short-lived until the Strait of Hormuz is truly reopened—rather than conditionally managed, subject to political quotas, or partially bypassed.”
Citigroup predicts Brent crude oil prices will reach $120 per barrel in the short term and warns that the oil market is underestimating the risk of prolonged supply disruptions. If the Strait of Hormuz only slowly reopens to navigation in the third quarter, oil prices could even surge to $150.
Citigroup made a striking prediction in its research report: global oil inventories will decrease by 1 billion barrels this year. At this rate of consumption, the buffer between the current supply situation and a genuine "physical shortage" is rapidly narrowing. For 2027, Citigroup's medium-term scenario predicts that Brent crude oil prices will remain in the $80 to $90 per barrel range, assuming that Iran eventually regains control of shipping flows in the Strait of Hormuz.
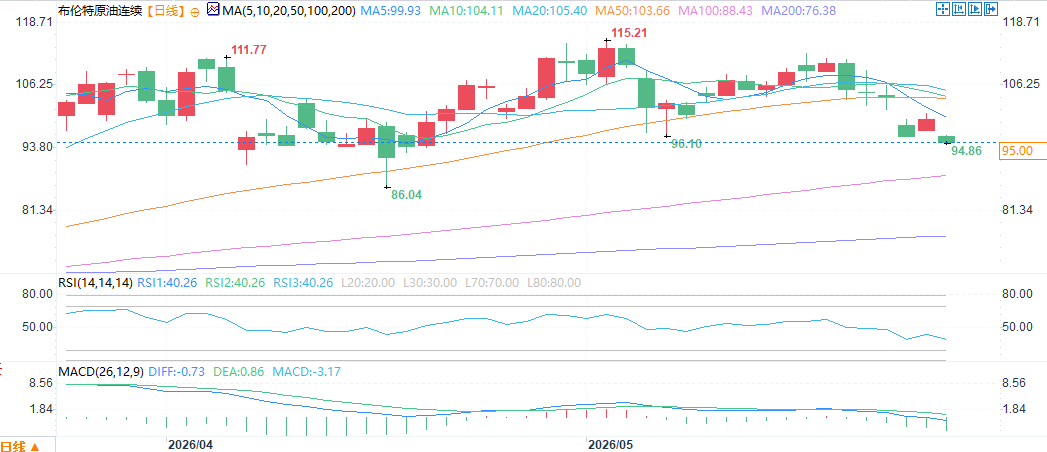
From the daily chart, Brent crude oil is currently trading around $95, in a weak consolidation phase after a recent pullback from its highs, with multiple technical indicators showing bearish signals.
(Brent crude oil daily chart, source: EasyForex)
Regarding the moving average system, the 5-day moving average (MA5) (99.93), 10-day moving average (MA10) (104.11), 20-day moving average (MA20) (105.40), and 50-day moving average (MA50) (103.66) are all above the current price, forming significant resistance. The current price has broken below all short-term moving averages, indicating a weak short-term trend. The 100-day moving average (MA100) (88.43) and 200-day moving average (MA200) are significantly lower than the current price, suggesting that the long-term upward trend has not been completely broken, but short-term downward pressure is increasing. The price has been trading below the 20-day and 50-day moving averages for several consecutive trading days, indicating a relatively clear short-term bearish pattern.
The RSI has entered the 40 zone, indicating that bears have a clear advantage. This reading is quite close to the oversold zone of 30, meaning that further downside potential may be limited. If the RSI falls below 30 into the oversold zone, a technical rebound may occur.
In summary, market optimism regarding a US-Iran agreement pushed oil prices slightly lower, but institutions such as Westpac warned that the decline in oil prices may remain limited until the Strait of Hormuz is truly reopened. The continued disagreements between the US and Iran on key issues such as asset freezes, and the ongoing military conflict, indicate that geopolitical risk premiums have not yet fully subsided.
In the short term, oil prices are expected to remain volatile at high levels, with the direction depending on the substantive progress of the US-Iran negotiations and the navigation status of the Strait of Hormuz.
At 13:38 Beijing time on May 27, Brent crude oil was trading at $95.00 per barrel.
Brent crude fell more than 4% to around $95 a barrel on Wednesday (May 27), while West Texas Intermediate crude traded below $92.
U.S. Secretary of State Marco Rubio warned that any peace agreement could take several more days to be finalized.
Geopolitical developments: The US-Iran military conflict continues, but two oil tankers successfully transited the Strait of Hormuz.
Meanwhile, the U.S. military struck targets near the strait, and Iran's Islamic Revolutionary Guard Corps stated that it fired on several U.S. aircraft after they entered Iranian airspace. The strait, a crucial waterway through which one-fifth of the world's oil and liquefied natural gas flows during peacetime, remains largely closed and is blocked by the U.S. and Iran.
However, at least two non-Iranian supertankers sailed out of this choke point on Tuesday, marking the first time in two weeks that 4 million barrels of unsanctioned crude oil had been observed to pass through.
Market forecast: The probability of the Strait of Hormuz opening to navigation by the end of June has fallen to 50%.
Observing and forecasting the market, the expected probability of traffic in the Strait of Hormuz returning to normal by the end of June (the issue the market is most concerned about) surged to 70% over the weekend, but has now fallen back to a "coin toss" level of around 50%.
Overall, price action so far this week highlights the market's asymmetric reaction pattern to news from Iran. Traders will continue to be skeptical of established trends until this dynamic changes.
Institutional Views
Robert Lenny, head of commodities research at Westpac, said: “The market is trading on the prospect of an Iran deal, but the clean reopening story is still months or even quarters away: the Strait remains technically closed, and a physical reset will take time. Brent crude may dip on the optimism surrounding the deal, but the price drop is likely to be shallow and short-lived until the Strait of Hormuz is truly reopened—rather than conditionally managed, subject to political quotas, or partially bypassed.”
Citigroup predicts Brent crude oil prices will reach $120 per barrel in the short term and warns that the oil market is underestimating the risk of prolonged supply disruptions. If the Strait of Hormuz only slowly reopens to navigation in the third quarter, oil prices could even surge to $150.
Citigroup made a striking prediction in its research report: global oil inventories will decrease by 1 billion barrels this year. At this rate of consumption, the buffer between the current supply situation and a genuine "physical shortage" is rapidly narrowing. For 2027, Citigroup's medium-term scenario predicts that Brent crude oil prices will remain in the $80 to $90 per barrel range, assuming that Iran eventually regains control of shipping flows in the Strait of Hormuz.
Brent crude oil daily technical analysis
From the daily chart, Brent crude oil is currently trading around $95, in a weak consolidation phase after a recent pullback from its highs, with multiple technical indicators showing bearish signals.
(Brent crude oil daily chart, source: EasyForex)
Regarding the moving average system, the 5-day moving average (MA5) (99.93), 10-day moving average (MA10) (104.11), 20-day moving average (MA20) (105.40), and 50-day moving average (MA50) (103.66) are all above the current price, forming significant resistance. The current price has broken below all short-term moving averages, indicating a weak short-term trend. The 100-day moving average (MA100) (88.43) and 200-day moving average (MA200) are significantly lower than the current price, suggesting that the long-term upward trend has not been completely broken, but short-term downward pressure is increasing. The price has been trading below the 20-day and 50-day moving averages for several consecutive trading days, indicating a relatively clear short-term bearish pattern.
The RSI has entered the 40 zone, indicating that bears have a clear advantage. This reading is quite close to the oversold zone of 30, meaning that further downside potential may be limited. If the RSI falls below 30 into the oversold zone, a technical rebound may occur.
The market's asymmetric reaction continues, and oil prices are bearish in the short term, but a reversal should be watched closely.
In summary, market optimism regarding a US-Iran agreement pushed oil prices slightly lower, but institutions such as Westpac warned that the decline in oil prices may remain limited until the Strait of Hormuz is truly reopened. The continued disagreements between the US and Iran on key issues such as asset freezes, and the ongoing military conflict, indicate that geopolitical risk premiums have not yet fully subsided.
In the short term, oil prices are expected to remain volatile at high levels, with the direction depending on the substantive progress of the US-Iran negotiations and the navigation status of the Strait of Hormuz.
At 13:38 Beijing time on May 27, Brent crude oil was trading at $95.00 per barrel.
- Risk Warning and Disclaimer
- The market involves risk, and trading may not be suitable for all investors. This article is for reference only and does not constitute personal investment advice, nor does it take into account certain users’ specific investment objectives, financial situation, or other needs. Any investment decisions made based on this information are at your own risk.