The decline in oil prices eased import pressures, and the dollar consolidated, causing the dollar to weaken slightly against the Indian rupee.
2026-05-27 15:36:19
The US dollar edged lower against the Indian rupee (USD/INR) in Asian trading on Wednesday, falling back to around 95.70. Current market movements are mainly influenced by the pullback in international oil prices, progress in US-Iran negotiations, and a short-term consolidation in the US dollar. International oil prices saw a significant decline on Wednesday, with WTI crude falling to around $90.80, a daily drop of nearly 1.8%. Previously, international oil prices had risen rapidly due to continued tensions in the Middle East, but tensions in the energy market eased as market expectations for a US-Iran agreement grew.
India is one of the world's major crude oil importers. Therefore, changes in international oil prices have a significant impact on the Indian rupee's exchange rate. Generally, rising oil prices increase India's energy import costs and widen its trade deficit, thus putting pressure on the rupee; while falling oil prices help alleviate India's external payment pressures and improve market expectations for the stability of the Indian economy.
The market is currently focused on the progress of negotiations between the US and Iran regarding a long-term ceasefire and the resumption of shipping in the Strait of Hormuz. Despite recent military clashes between the two countries, negotiations have not been interrupted. Iran's Islamic Revolutionary Guard Corps recently warned of retaliation for the US military strikes in southern Iran. The Iranian Foreign Ministry condemned the US actions as a serious violation of the current ceasefire agreement.
However, the US and Iran are continuing negotiations through intermediaries such as Qatar. Market sources indicate that the issue of frozen Iranian assets may be one of the last remaining major points of contention. The Strait of Hormuz handles approximately 20% of global maritime energy transport. Therefore, the market is paying close attention to developments in the region, as these will directly impact international oil prices and global inflation expectations.
US Secretary of State Marco Rubio previously stated that the Strait of Hormuz "must remain open," and that a final agreement between the US and Iran may still take several days to be finalized. With the market believing that an agreement is still possible, the recent pullback in international oil prices from their highs has also provided some support for the Indian rupee.
On the other hand, the US dollar index is currently consolidating in a narrow range around 99. Investors are awaiting the US April PCE price index data to determine the future policy direction of the Federal Reserve. The market expects the US core PCE annual rate to rise to 3.3%. If the data is higher than market expectations, it may reinforce market expectations that the Federal Reserve will maintain high interest rates and drive the dollar to strengthen again.
However, ahead of the PCE data release, market sentiment was relatively cautious, and the dollar's short-term gains temporarily slowed. Meanwhile, fund flows in the Indian stock market remained volatile. The recent frequent shifts in buying and selling activity by overseas institutional investors in the Indian market indicate that current market sentiment remains unstable.
Data shows that overseas institutional investors were net sellers of approximately 240.787 billion rupees in assets on Tuesday, compared to net purchases of approximately 82.175 billion rupees on Monday. This outflow of foreign capital limits the rupee's further appreciation potential in the short term. However, the Indian rupee still received some support overall due to the decline in international oil prices.
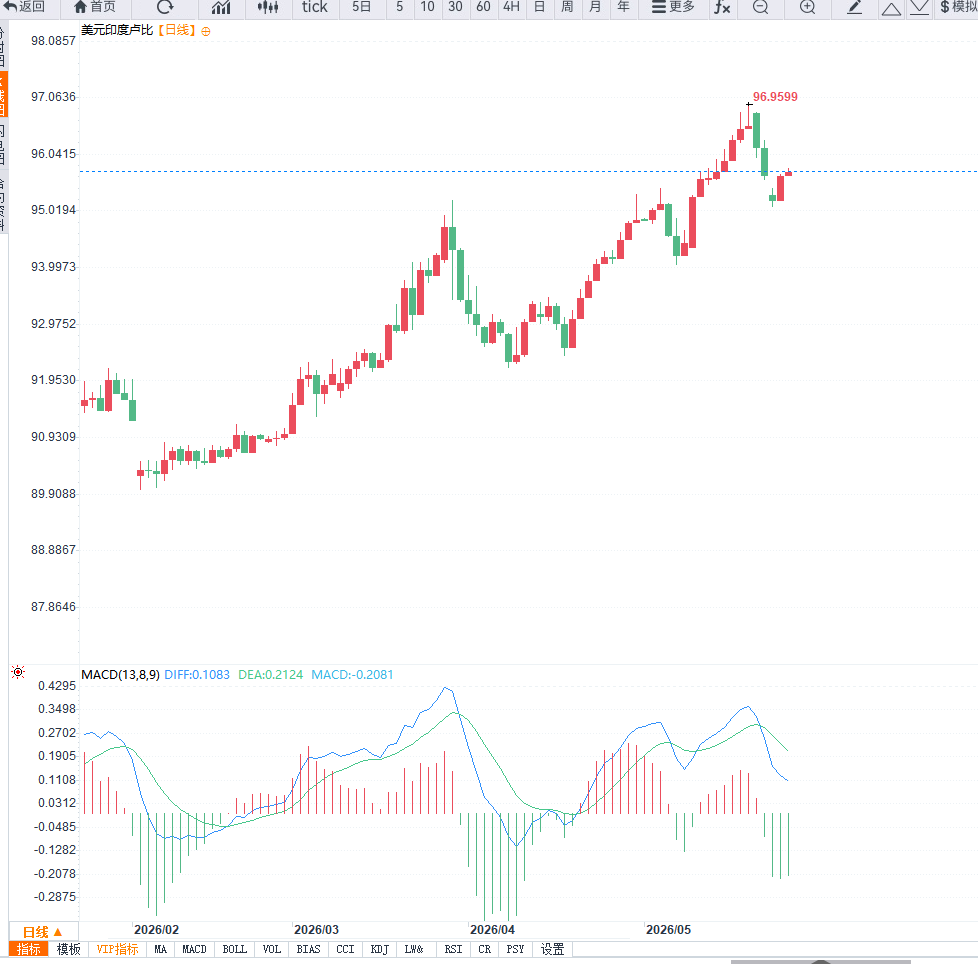
From the daily chart, the USD/INR pair maintains a generally bullish medium-term consolidation structure. The exchange rate continues to trade above the 20-day exponential moving average (EMA), currently around 95.44, indicating that the medium-term bullish trend has not been completely broken. The EMA continues to slope upwards, suggesting that the overall upward structure of the market remains intact. The MACD indicator is currently still above the zero line, but the red momentum bars are starting to narrow, indicating a slowdown in short-term bullish momentum. The RSI indicator remains around 56, reflecting bullish market sentiment, but has not yet entered clearly overbought territory, meaning that the exchange rate still has room for further gains.
Looking at the upside, 96.37 is currently a key resistance area, and also a significant high formed on May 22. If the exchange rate subsequently regains this level, the USD/INR pair may once again challenge the historical high area near 97.00.
Investors are currently focusing on US PCE data, international oil price trends, and the progress of US-Iran negotiations. The market is also closely monitoring overseas capital flows, as changes in capital flows will directly impact the short-term performance of the Indian rupee.
Editor's Summary : The current USD/IRR market is balancing between falling international oil prices and expectations of high US interest rates. The pullback in international oil prices has eased import cost pressures on India, providing temporary support for the rupee; however, the Federal Reserve's continued high interest rate expectations and the overall strength of the US dollar limit the downside potential of the exchange rate. From a technical perspective, the USD/IRR daily chart still maintains a generally bullish trend, but has entered a consolidation phase at higher levels in the short term. Future market movements will largely depend on US PCE data, developments in the Middle East, and the direction of international oil prices.
India is one of the world's major crude oil importers. Therefore, changes in international oil prices have a significant impact on the Indian rupee's exchange rate. Generally, rising oil prices increase India's energy import costs and widen its trade deficit, thus putting pressure on the rupee; while falling oil prices help alleviate India's external payment pressures and improve market expectations for the stability of the Indian economy.
The market is currently focused on the progress of negotiations between the US and Iran regarding a long-term ceasefire and the resumption of shipping in the Strait of Hormuz. Despite recent military clashes between the two countries, negotiations have not been interrupted. Iran's Islamic Revolutionary Guard Corps recently warned of retaliation for the US military strikes in southern Iran. The Iranian Foreign Ministry condemned the US actions as a serious violation of the current ceasefire agreement.
However, the US and Iran are continuing negotiations through intermediaries such as Qatar. Market sources indicate that the issue of frozen Iranian assets may be one of the last remaining major points of contention. The Strait of Hormuz handles approximately 20% of global maritime energy transport. Therefore, the market is paying close attention to developments in the region, as these will directly impact international oil prices and global inflation expectations.
US Secretary of State Marco Rubio previously stated that the Strait of Hormuz "must remain open," and that a final agreement between the US and Iran may still take several days to be finalized. With the market believing that an agreement is still possible, the recent pullback in international oil prices from their highs has also provided some support for the Indian rupee.
On the other hand, the US dollar index is currently consolidating in a narrow range around 99. Investors are awaiting the US April PCE price index data to determine the future policy direction of the Federal Reserve. The market expects the US core PCE annual rate to rise to 3.3%. If the data is higher than market expectations, it may reinforce market expectations that the Federal Reserve will maintain high interest rates and drive the dollar to strengthen again.
However, ahead of the PCE data release, market sentiment was relatively cautious, and the dollar's short-term gains temporarily slowed. Meanwhile, fund flows in the Indian stock market remained volatile. The recent frequent shifts in buying and selling activity by overseas institutional investors in the Indian market indicate that current market sentiment remains unstable.
Data shows that overseas institutional investors were net sellers of approximately 240.787 billion rupees in assets on Tuesday, compared to net purchases of approximately 82.175 billion rupees on Monday. This outflow of foreign capital limits the rupee's further appreciation potential in the short term. However, the Indian rupee still received some support overall due to the decline in international oil prices.
From the daily chart, the USD/INR pair maintains a generally bullish medium-term consolidation structure. The exchange rate continues to trade above the 20-day exponential moving average (EMA), currently around 95.44, indicating that the medium-term bullish trend has not been completely broken. The EMA continues to slope upwards, suggesting that the overall upward structure of the market remains intact. The MACD indicator is currently still above the zero line, but the red momentum bars are starting to narrow, indicating a slowdown in short-term bullish momentum. The RSI indicator remains around 56, reflecting bullish market sentiment, but has not yet entered clearly overbought territory, meaning that the exchange rate still has room for further gains.
Looking at the upside, 96.37 is currently a key resistance area, and also a significant high formed on May 22. If the exchange rate subsequently regains this level, the USD/INR pair may once again challenge the historical high area near 97.00.
Investors are currently focusing on US PCE data, international oil price trends, and the progress of US-Iran negotiations. The market is also closely monitoring overseas capital flows, as changes in capital flows will directly impact the short-term performance of the Indian rupee.
Editor's Summary : The current USD/IRR market is balancing between falling international oil prices and expectations of high US interest rates. The pullback in international oil prices has eased import cost pressures on India, providing temporary support for the rupee; however, the Federal Reserve's continued high interest rate expectations and the overall strength of the US dollar limit the downside potential of the exchange rate. From a technical perspective, the USD/IRR daily chart still maintains a generally bullish trend, but has entered a consolidation phase at higher levels in the short term. Future market movements will largely depend on US PCE data, developments in the Middle East, and the direction of international oil prices.
- Risk Warning and Disclaimer
- The market involves risk, and trading may not be suitable for all investors. This article is for reference only and does not constitute personal investment advice, nor does it take into account certain users’ specific investment objectives, financial situation, or other needs. Any investment decisions made based on this information are at your own risk.