After three consecutive days of gains, the US dollar index has slightly retreated. How long can the upward trend continue?
2026-06-04 16:25:50
On Thursday (June 4), the US dollar index fluctuated at high levels, currently trading slightly lower around 99.40, after rising for three consecutive trading days. Lloyd Chan, an analyst at Mitsubishi UFJ Financial Group, pointed out that the continued high Brent crude oil prices due to ongoing US-Iran tensions provided support for the dollar. After three consecutive days of gains, the dollar index has slightly retreated; how long can this upward trend continue?
At the same time, strong U.S. economic data (including ADP employment and the ISM services index) further reinforced market expectations that the Federal Reserve would maintain higher interest rates for longer.

Brent crude oil prices remained high, progress on the US-Iran peace agreement remained stalled, and geopolitical risk premiums persisted.
Against this backdrop, the US dollar index had previously strengthened moderately, supported by two factors: first, safe-haven demand driven by tensions in the Middle East; and second, a renewed rise in US front-end yields, with the 2-year Treasury yield remaining above 4%.
A wide interest rate differential has strengthened the support for the US dollar through carry trades—investors borrow low-interest currencies and buy dollar assets to profit from the interest rate differential. Even though the Israel-Lebanon ceasefire agreement briefly triggered a slight pullback in the dollar, the decline was limited. Unless there is a major breakthrough in US-Iran negotiations or significant weakness in US economic data, the dollar is expected to remain relatively strong in the short term.
The U.S. macroeconomic momentum remains resilient. ADP employment increased by 122,000 in May, up from 105,000 in April and slightly above market expectations of 120,000. Meanwhile, the ISM services index rose from 53.6 to 54.5, also exceeding the expected 53.8, indicating a faster pace of expansion in the services sector.
Looking at the detailed data, new orders accelerated sharply from 53.5 to 57.3, highlighting continued strong demand; however, employment in the service sector declined slightly from 48.0 to 47.9, remaining in contraction territory, indicating that the job market is not entirely improving. The prices paid index rose from 70.7 to 71.3, slightly below expectations but still at a high level, suggesting that inflationary pressures have not yet subsided.
The strong performance of US macroeconomic data has further solidified market expectations that the Federal Reserve will maintain higher interest rates for longer, an expectation that is triggering a chain reaction in Asian foreign exchange markets.
First, some currencies are highly sensitive to changes in US Treasury yields. The Japanese yen, South Korean won, and Singapore dollar are particularly notable examples. Because these economies have significant interest rate differentials with the Federal Reserve, and because their financial markets are deep and capital flows are free, funds tend to quickly withdraw from these currencies and flow into dollar assets when US Treasury yields rise, putting pressure on their exchange rates.
Secondly, other Asian currencies also face pressure. The Indonesian rupiah, Philippine peso, and Indian rupee are also significantly pressured by rising US interest rate expectations. While these currencies are slightly less sensitive to yields than the other three, they are still affected by both capital outflows and declining risk appetite. Indonesia and India, in particular, as current account deficit countries, are highly dependent on external financing, and a stronger dollar and tightening global liquidity will directly increase their balance of payments pressures.
The weekly initial jobless claims data for the United States, to be released later today, could provide important incremental guidance for Friday's non-farm payrolls report.
Initial jobless claims are a high-frequency indicator of the health of the labor market, and changes in their trend often reveal marginal shifts in the job market in advance. If initial claims rise unexpectedly sharply, it may suggest a loosening of the labor market, weakening the Federal Reserve's case for maintaining high interest rates; if they remain low, it indicates that the labor market remains tight, supporting the Fed's hawkish stance.
Historically, initial jobless claims data and non-farm payrolls have shown a certain negative correlation. Today's initial jobless claims data will provide the market with early clues about Friday's non-farm payrolls report: if initial claims are better than expected (lower than anticipated), market expectations for the non-farm payrolls report will further increase, and the US dollar may receive support in advance; if initial claims are worse than expected, it may trigger a short-term pullback in the US dollar, and market expectations for the non-farm payrolls report will be lowered accordingly. Traders will adjust their positions and make advance arrangements accordingly.
The US dollar index has been oscillating upwards from its recent low of around 95.57, and is currently trading around 99.45. It has stabilized above several key moving averages on the chart, facing short-term pressure at the previous high of 99.56, with key resistance at 100.64. The moving averages across various timeframes are in a bullish alignment, providing support. Support levels are concentrated at the 20-day and 50-day moving averages (98.97-98.90) and the recent low of 97.62. Overall, the index is in a slightly bullish consolidation pattern after a low-level rebound.
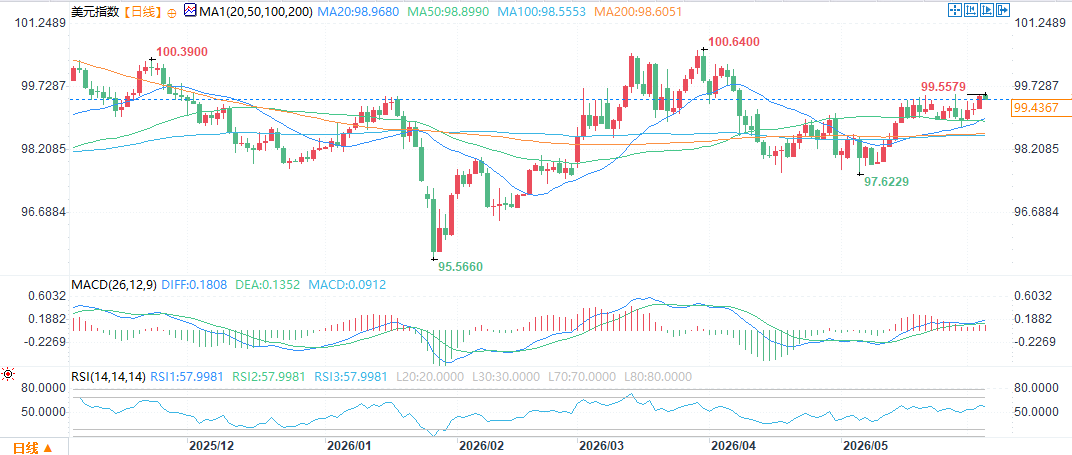
(US Dollar Index Daily Chart, Source: FX678)
The MACD lines remain above the zero line and the red bars continue, indicating that the short-term bullish momentum still exists. The RSI is at 57.99, close to the critical overbought line, but has not yet entered the overbought zone. The short-term market is biased towards bullish fluctuations. If it can hold above 99.56, it will rise further. Only if it falls back and breaks below 98.90 will the short-term strong trend end.
At 16:24 Beijing time on June 4, the US dollar index was at 99.45.
At the same time, strong U.S. economic data (including ADP employment and the ISM services index) further reinforced market expectations that the Federal Reserve would maintain higher interest rates for longer.
Geopolitical risks and yields support the US dollar
Brent crude oil prices remained high, progress on the US-Iran peace agreement remained stalled, and geopolitical risk premiums persisted.
Against this backdrop, the US dollar index had previously strengthened moderately, supported by two factors: first, safe-haven demand driven by tensions in the Middle East; and second, a renewed rise in US front-end yields, with the 2-year Treasury yield remaining above 4%.
A wide interest rate differential has strengthened the support for the US dollar through carry trades—investors borrow low-interest currencies and buy dollar assets to profit from the interest rate differential. Even though the Israel-Lebanon ceasefire agreement briefly triggered a slight pullback in the dollar, the decline was limited. Unless there is a major breakthrough in US-Iran negotiations or significant weakness in US economic data, the dollar is expected to remain relatively strong in the short term.
US data reinforces expectations of "higher and longer" growth.
The U.S. macroeconomic momentum remains resilient. ADP employment increased by 122,000 in May, up from 105,000 in April and slightly above market expectations of 120,000. Meanwhile, the ISM services index rose from 53.6 to 54.5, also exceeding the expected 53.8, indicating a faster pace of expansion in the services sector.
Looking at the detailed data, new orders accelerated sharply from 53.5 to 57.3, highlighting continued strong demand; however, employment in the service sector declined slightly from 48.0 to 47.9, remaining in contraction territory, indicating that the job market is not entirely improving. The prices paid index rose from 70.7 to 71.3, slightly below expectations but still at a high level, suggesting that inflationary pressures have not yet subsided.
Impact on Asian foreign exchange markets
The strong performance of US macroeconomic data has further solidified market expectations that the Federal Reserve will maintain higher interest rates for longer, an expectation that is triggering a chain reaction in Asian foreign exchange markets.
First, some currencies are highly sensitive to changes in US Treasury yields. The Japanese yen, South Korean won, and Singapore dollar are particularly notable examples. Because these economies have significant interest rate differentials with the Federal Reserve, and because their financial markets are deep and capital flows are free, funds tend to quickly withdraw from these currencies and flow into dollar assets when US Treasury yields rise, putting pressure on their exchange rates.
Secondly, other Asian currencies also face pressure. The Indonesian rupiah, Philippine peso, and Indian rupee are also significantly pressured by rising US interest rate expectations. While these currencies are slightly less sensitive to yields than the other three, they are still affected by both capital outflows and declining risk appetite. Indonesia and India, in particular, as current account deficit countries, are highly dependent on external financing, and a stronger dollar and tightening global liquidity will directly increase their balance of payments pressures.
Market focus on initial jobless claims data
The weekly initial jobless claims data for the United States, to be released later today, could provide important incremental guidance for Friday's non-farm payrolls report.
Initial jobless claims are a high-frequency indicator of the health of the labor market, and changes in their trend often reveal marginal shifts in the job market in advance. If initial claims rise unexpectedly sharply, it may suggest a loosening of the labor market, weakening the Federal Reserve's case for maintaining high interest rates; if they remain low, it indicates that the labor market remains tight, supporting the Fed's hawkish stance.
Historically, initial jobless claims data and non-farm payrolls have shown a certain negative correlation. Today's initial jobless claims data will provide the market with early clues about Friday's non-farm payrolls report: if initial claims are better than expected (lower than anticipated), market expectations for the non-farm payrolls report will further increase, and the US dollar may receive support in advance; if initial claims are worse than expected, it may trigger a short-term pullback in the US dollar, and market expectations for the non-farm payrolls report will be lowered accordingly. Traders will adjust their positions and make advance arrangements accordingly.
Technical Analysis
The US dollar index has been oscillating upwards from its recent low of around 95.57, and is currently trading around 99.45. It has stabilized above several key moving averages on the chart, facing short-term pressure at the previous high of 99.56, with key resistance at 100.64. The moving averages across various timeframes are in a bullish alignment, providing support. Support levels are concentrated at the 20-day and 50-day moving averages (98.97-98.90) and the recent low of 97.62. Overall, the index is in a slightly bullish consolidation pattern after a low-level rebound.
(US Dollar Index Daily Chart, Source: FX678)
The MACD lines remain above the zero line and the red bars continue, indicating that the short-term bullish momentum still exists. The RSI is at 57.99, close to the critical overbought line, but has not yet entered the overbought zone. The short-term market is biased towards bullish fluctuations. If it can hold above 99.56, it will rise further. Only if it falls back and breaks below 98.90 will the short-term strong trend end.
At 16:24 Beijing time on June 4, the US dollar index was at 99.45.
- Risk Warning and Disclaimer
- The market involves risk, and trading may not be suitable for all investors. This article is for reference only and does not constitute personal investment advice, nor does it take into account certain users’ specific investment objectives, financial situation, or other needs. Any investment decisions made based on this information are at your own risk.