Geopolitical tensions and structural pressures make $86 a key level for medium-term bullish or bearish sentiment in crude oil.
2026-06-06 01:29:25
In the first half of 2026, geopolitical conflicts in the Middle East continued to impact the global energy market. The US-Israel military action against Iran, which began on February 28, severely disrupted traffic through the Strait of Hormuz, a crucial oil shipping route. Normally, the strait handles approximately 20.9 million barrels of crude oil and petroleum products daily, accounting for about 25% of global seaborne oil trade, primarily destined for Asian markets. Following the conflict, traffic volume plummeted to about 5% of normal levels, triggering global energy supply shortages and significant oil price volatility.

How much crude oil production will be affected by the obstruction of traffic through the Strait of Hormuz?
As of early June 2026, the Strait of Hormuz remained largely unnavigable. While a few vessels passed through the strait under coordinated arrangements or with the assistance of "shadow fleets" (and some Iranian crude oil continued to flow to specific markets on a small scale), overall commercial traffic was extremely low. According to data from Kpler and Lloyd's List Intelligence, before the conflict, approximately 130-140 vessels passed through the strait daily, with oil tankers carrying approximately 15-21 million barrels of crude oil and products per day. After the conflict, only 191 vessels were recorded passing through in April, and although there was a slight increase in May, it remained far below normal levels. Many shipowners remained cautious due to high insurance costs and security risks.
The estimated daily impact on crude oil production is around 10-14 million barrels (total disruption), resulting in a net supply gap of approximately 10.5-12 million barrels per day (considering some detours, buffer inventories, and increased production outside the Gulf). IEA and EIA data show that Middle Eastern oil-producing countries have been forced to shut down significant amounts of production capacity due to export disruptions, disrupting about one-fifth of global oil flows. Asian refineries are experiencing feedstock shortages, leading to tight supplies of refined petroleum products. More than 1,500-2,000 ships are stranded in the Persian Gulf, affecting tens of thousands of seafarers. The U.S. Central Command announced on June 4 that it had intercepted and diverted 127 ships since the blockade began on April 13.
Even after ceasefire negotiations and rumors of an agreement, traffic remains sluggish, with daily vessel passage typically ranging from single digits to low double digits. The P&I Insurance Club's cautious underwriting in the theater further delays recovery. Iran maintains pressure through selective passage and threats, while US naval operations targeting specific vessels further complicate the situation.
Crude oil inventory reduction and supply-demand gap
The current crude oil inventory data is supporting higher Brent crude oil prices, indicating a significant supply-demand gap, which is the core fundamental support for oil prices. The EIA's Short-Term Energy Outlook (STEO) indicates that global oil inventories will decrease by an average of 8.5 million barrels per day in the second quarter of 2026, a record rate of decline. The IEA's May report also showed a tight supply-demand balance in March-June, with inventories falling rapidly.
Global total oil inventories have fallen from a pre-conflict high of approximately 8 billion barrels to around 7.8 billion barrels by the end of April. Available commercial operating buffer inventories are tighter (around 800 million barrels), and their nature differs: the former includes strategic reserves, while the latter directly impacts market liquidity. If the Strait of Hormuz remains blocked, inventories could further decline to critical lows between May and September. US crude oil inventories have fallen sharply for several consecutive weeks, with Cushing terminals nearing low levels. Increased production in non-Gulf regions (such as US shale, Brazil, and Guyana) is unlikely to immediately fill the gap, and the release of strategic petroleum reserves only provides a short-term buffer.
Demand has contracted somewhat due to high oil prices, with the IEA predicting a global demand decrease of approximately 420,000 barrels per day in 2026, with a larger decline in the second quarter. However, the peak summer consumption season, the recovery of aviation, and petrochemical demand continue to provide support. The supply-demand imbalance drove Brent crude oil prices up rapidly after the conflict, reaching a spot high of $138 per barrel on April 7 (some sources indicate intraday or futures highs approached $140, the highest level since 2008). Recently, prices have fluctuated under the influence of negotiation expectations and inventory data.
As of around June 5, 2026, Brent crude oil prices are expected to fluctuate between $92 and $101 per barrel (around $95 at the close on June 5). Goldman Sachs and other institutions maintain high forecasts, suggesting a high probability of a short-term rebound to above $100 if the disruption continues.
Analysts disagree: Risk of war escalation has decreased, risk premium may dissipate quickly.
Some analysts hold an optimistic view, believing that the risk of escalation of the war has significantly decreased, the geopolitical risk premium will soon decline, and the oil market may re-enter a state of oversupply. Key reasons include: the US-Iran ceasefire negotiations, though tortuous, are progressing steadily; the Trump administration is sending diplomatic signals; Israel's actions in the region have shown signs of easing; internal economic pressures in Iran may drive a compromise; other global supply sources are accelerating production due to high oil prices; and demand is further weakening due to high prices and a potential economic slowdown.
Historical experience shows that geopolitical risk premiums tend to decline rapidly once the situation becomes clearer. If the Strait of Hormuz passage gradually resumes under escort or agreement (even if slowly at first), coupled with potential adjustments by OPEC+, a market easing trend may emerge within months, putting downward pressure on oil prices.
While mainstream institutions predict a continued tight supply, in some scenarios, barring major upgrades, prices could fall back to the $70-90 range by the end of 2026. The EIA's own outlook also assumes that after the Straits Exchange Foundation gradually recovers from June, inventory reduction will slow, with the average Brent price falling to around $89 in the fourth quarter, and further declining in 2027.
Overall Outlook
As of June 5, 2026, the latest developments indicate that the situation remains uncertain: the US Central Command maintains its blockade operations; Iran's "shadow fleet" has been active on a small scale, but overall commercial passage is restricted; Trump emphasizes that the Strait of Hormuz must be opened unconditionally; the IEA/EIA maintains its tight balance forecast for the second quarter. Oil prices have experienced a rollercoaster ride: easing news led to a pullback, while inventory reduction and concerns about disruptions drove a rebound.
The tight fundamentals (rapid inventory depletion + large supply gap) provide strong short-term support for oil prices. Brent crude is highly likely to return above $100 within the next three months, especially should negotiations drag on or unexpected events occur. In the long term (end of 2026 to 2027), barring major escalations, the gradual resumption of cross-strait traffic, increased non-OPEC production, and demand adjustments will drive the market towards a more relaxed stance, with prices falling back to the $70-90 range.
The transmission effects of high oil prices are evident: global inflationary pressures are rising, costs are increasing in Asian importing countries, and the aviation and manufacturing sectors are under pressure; while oil-producing countries are experiencing fiscal improvements, those facing export difficulties are tackling challenges. At the macro level, central bank policies face the dual dilemma of high inflation and economic slowdown.
Overall, the crude oil market is in a phase of "tight fundamental balance driven by geopolitical risks." Bullish views are based on the current disruptions, while bearish views bet on rapid pricing of risks and supply recovery. The pace of the resumption of Strait of Hormuz traffic will be a key variable in the coming weeks. Market volatility is high, and participants should manage their risks carefully.
Technical Analysis
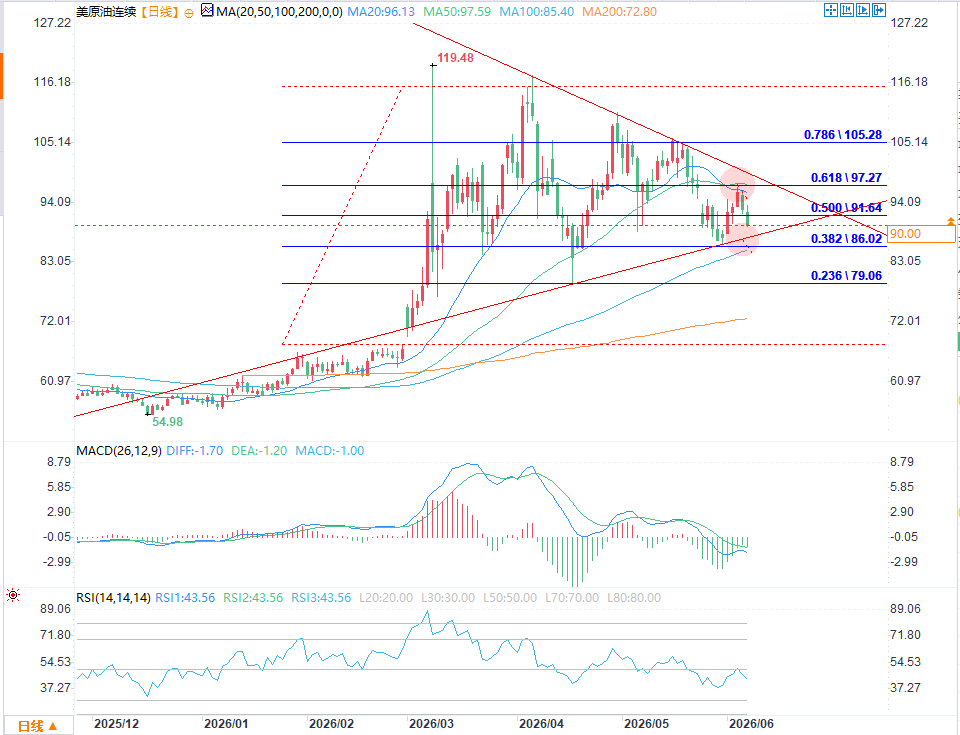
(WTI crude oil daily chart source: FX678)
US crude oil encountered resistance at 97.27 (0.618 Fibonacci + MA20 + MA50), and fell back. The short-term moving averages formed a death cross, and the market entered a downward channel.
The current price is fluctuating around the 90 mark. The key support/resistance level is at 86.02, where the 0.382 Fibonacci retracement level, the 100-day moving average, and the medium-to-long-term upward trend line converge, making it a crucial support level for this upward trend.
In terms of indicators, the MACD is in the bearish zone below the zero line, and the green bars continue; the RSI is 43.56 and has not yet entered oversold territory, indicating that short-term bearish momentum still exists, and the price still has a probability of testing 86.
There are two possible paths for the market: If the daily chart stabilizes and holds above $86, the major uptrend remains intact, and the rebound targets after the pullback are 91.64 (0.5) and 97.27 respectively; if the daily chart breaks below $86, the medium-term uptrend structure will be broken, opening up downside potential, with the first downside target at $79.06 (0.236 Fibonacci retracement), and if $79 is breached, the market will further test the previous low of $72.
Short-term rebounds are facing significant resistance in the 93-95 range, a key area for shorting. Only a break above the 97.27 resistance level with strong volume can reverse the short-term downtrend. Oil prices remain influenced by fundamental factors such as OPEC, geopolitics, and inventory levels; any breakouts require confirmation from news events.
How much crude oil production will be affected by the obstruction of traffic through the Strait of Hormuz?
As of early June 2026, the Strait of Hormuz remained largely unnavigable. While a few vessels passed through the strait under coordinated arrangements or with the assistance of "shadow fleets" (and some Iranian crude oil continued to flow to specific markets on a small scale), overall commercial traffic was extremely low. According to data from Kpler and Lloyd's List Intelligence, before the conflict, approximately 130-140 vessels passed through the strait daily, with oil tankers carrying approximately 15-21 million barrels of crude oil and products per day. After the conflict, only 191 vessels were recorded passing through in April, and although there was a slight increase in May, it remained far below normal levels. Many shipowners remained cautious due to high insurance costs and security risks.
The estimated daily impact on crude oil production is around 10-14 million barrels (total disruption), resulting in a net supply gap of approximately 10.5-12 million barrels per day (considering some detours, buffer inventories, and increased production outside the Gulf). IEA and EIA data show that Middle Eastern oil-producing countries have been forced to shut down significant amounts of production capacity due to export disruptions, disrupting about one-fifth of global oil flows. Asian refineries are experiencing feedstock shortages, leading to tight supplies of refined petroleum products. More than 1,500-2,000 ships are stranded in the Persian Gulf, affecting tens of thousands of seafarers. The U.S. Central Command announced on June 4 that it had intercepted and diverted 127 ships since the blockade began on April 13.
Even after ceasefire negotiations and rumors of an agreement, traffic remains sluggish, with daily vessel passage typically ranging from single digits to low double digits. The P&I Insurance Club's cautious underwriting in the theater further delays recovery. Iran maintains pressure through selective passage and threats, while US naval operations targeting specific vessels further complicate the situation.
Crude oil inventory reduction and supply-demand gap
The current crude oil inventory data is supporting higher Brent crude oil prices, indicating a significant supply-demand gap, which is the core fundamental support for oil prices. The EIA's Short-Term Energy Outlook (STEO) indicates that global oil inventories will decrease by an average of 8.5 million barrels per day in the second quarter of 2026, a record rate of decline. The IEA's May report also showed a tight supply-demand balance in March-June, with inventories falling rapidly.
Global total oil inventories have fallen from a pre-conflict high of approximately 8 billion barrels to around 7.8 billion barrels by the end of April. Available commercial operating buffer inventories are tighter (around 800 million barrels), and their nature differs: the former includes strategic reserves, while the latter directly impacts market liquidity. If the Strait of Hormuz remains blocked, inventories could further decline to critical lows between May and September. US crude oil inventories have fallen sharply for several consecutive weeks, with Cushing terminals nearing low levels. Increased production in non-Gulf regions (such as US shale, Brazil, and Guyana) is unlikely to immediately fill the gap, and the release of strategic petroleum reserves only provides a short-term buffer.
Demand has contracted somewhat due to high oil prices, with the IEA predicting a global demand decrease of approximately 420,000 barrels per day in 2026, with a larger decline in the second quarter. However, the peak summer consumption season, the recovery of aviation, and petrochemical demand continue to provide support. The supply-demand imbalance drove Brent crude oil prices up rapidly after the conflict, reaching a spot high of $138 per barrel on April 7 (some sources indicate intraday or futures highs approached $140, the highest level since 2008). Recently, prices have fluctuated under the influence of negotiation expectations and inventory data.
As of around June 5, 2026, Brent crude oil prices are expected to fluctuate between $92 and $101 per barrel (around $95 at the close on June 5). Goldman Sachs and other institutions maintain high forecasts, suggesting a high probability of a short-term rebound to above $100 if the disruption continues.
Analysts disagree: Risk of war escalation has decreased, risk premium may dissipate quickly.
Some analysts hold an optimistic view, believing that the risk of escalation of the war has significantly decreased, the geopolitical risk premium will soon decline, and the oil market may re-enter a state of oversupply. Key reasons include: the US-Iran ceasefire negotiations, though tortuous, are progressing steadily; the Trump administration is sending diplomatic signals; Israel's actions in the region have shown signs of easing; internal economic pressures in Iran may drive a compromise; other global supply sources are accelerating production due to high oil prices; and demand is further weakening due to high prices and a potential economic slowdown.
Historical experience shows that geopolitical risk premiums tend to decline rapidly once the situation becomes clearer. If the Strait of Hormuz passage gradually resumes under escort or agreement (even if slowly at first), coupled with potential adjustments by OPEC+, a market easing trend may emerge within months, putting downward pressure on oil prices.
While mainstream institutions predict a continued tight supply, in some scenarios, barring major upgrades, prices could fall back to the $70-90 range by the end of 2026. The EIA's own outlook also assumes that after the Straits Exchange Foundation gradually recovers from June, inventory reduction will slow, with the average Brent price falling to around $89 in the fourth quarter, and further declining in 2027.
Overall Outlook
As of June 5, 2026, the latest developments indicate that the situation remains uncertain: the US Central Command maintains its blockade operations; Iran's "shadow fleet" has been active on a small scale, but overall commercial passage is restricted; Trump emphasizes that the Strait of Hormuz must be opened unconditionally; the IEA/EIA maintains its tight balance forecast for the second quarter. Oil prices have experienced a rollercoaster ride: easing news led to a pullback, while inventory reduction and concerns about disruptions drove a rebound.
The tight fundamentals (rapid inventory depletion + large supply gap) provide strong short-term support for oil prices. Brent crude is highly likely to return above $100 within the next three months, especially should negotiations drag on or unexpected events occur. In the long term (end of 2026 to 2027), barring major escalations, the gradual resumption of cross-strait traffic, increased non-OPEC production, and demand adjustments will drive the market towards a more relaxed stance, with prices falling back to the $70-90 range.
The transmission effects of high oil prices are evident: global inflationary pressures are rising, costs are increasing in Asian importing countries, and the aviation and manufacturing sectors are under pressure; while oil-producing countries are experiencing fiscal improvements, those facing export difficulties are tackling challenges. At the macro level, central bank policies face the dual dilemma of high inflation and economic slowdown.
Overall, the crude oil market is in a phase of "tight fundamental balance driven by geopolitical risks." Bullish views are based on the current disruptions, while bearish views bet on rapid pricing of risks and supply recovery. The pace of the resumption of Strait of Hormuz traffic will be a key variable in the coming weeks. Market volatility is high, and participants should manage their risks carefully.
Technical Analysis
(WTI crude oil daily chart source: FX678)
US crude oil encountered resistance at 97.27 (0.618 Fibonacci + MA20 + MA50), and fell back. The short-term moving averages formed a death cross, and the market entered a downward channel.
The current price is fluctuating around the 90 mark. The key support/resistance level is at 86.02, where the 0.382 Fibonacci retracement level, the 100-day moving average, and the medium-to-long-term upward trend line converge, making it a crucial support level for this upward trend.
In terms of indicators, the MACD is in the bearish zone below the zero line, and the green bars continue; the RSI is 43.56 and has not yet entered oversold territory, indicating that short-term bearish momentum still exists, and the price still has a probability of testing 86.
There are two possible paths for the market: If the daily chart stabilizes and holds above $86, the major uptrend remains intact, and the rebound targets after the pullback are 91.64 (0.5) and 97.27 respectively; if the daily chart breaks below $86, the medium-term uptrend structure will be broken, opening up downside potential, with the first downside target at $79.06 (0.236 Fibonacci retracement), and if $79 is breached, the market will further test the previous low of $72.
Short-term rebounds are facing significant resistance in the 93-95 range, a key area for shorting. Only a break above the 97.27 resistance level with strong volume can reverse the short-term downtrend. Oil prices remain influenced by fundamental factors such as OPEC, geopolitics, and inventory levels; any breakouts require confirmation from news events.
- Risk Warning and Disclaimer
- The market involves risk, and trading may not be suitable for all investors. This article is for reference only and does not constitute personal investment advice, nor does it take into account certain users’ specific investment objectives, financial situation, or other needs. Any investment decisions made based on this information are at your own risk.