The contrasting inventory situations on both sides of the Atlantic: Cushing continues to reduce its inventory while ARA increases for three consecutive weeks. What signals does this crude oil price spread send?
2026-06-10 16:07:07
On Wednesday (June 10), during the Asian and European sessions, international oil prices continued to adjust, with WTI crude oil futures trading around $88.30 per barrel and Brent crude oil futures trading around $91.70 per barrel, widening the price difference between the two to over $3. This widening price difference is not statistical noise, but reflects the increasingly obvious inventory divergence between the two major storage centers, Cushing and ARA.
US Cushing inventories continued to decline due to high refinery utilization rates and export demand, while inventories in the European ARA hub accumulated for three consecutive weeks due to refinery maintenance and ample spot supply. This structural divergence is testing OPEC+'s production discipline. If the price spread widens further to above $3.50, it could trigger arbitrage flows and force OPEC+ to recalibrate its policies.

The fundamentals of the spot market are telling two very different stories.
In the United States, inventories at Cushing, Oklahoma, the delivery point for WTI crude futures, have fallen sharply over the past two weeks, primarily driven by high refinery utilization rates and export demand for light, sweet crude. Although overall U.S. crude oil inventories remain near their five-year average, the tightening inventory at the delivery hub has provided a floor for WTI.
Across the Atlantic, the situation is quite different. Crude oil inventories at the Amsterdam-Rotterdam-Antwerp (ARA) hub have increased for the third consecutive week, and floating storage near the European coast is also rising. This surplus reflects weak demand from European refineries during the maintenance season, as well as a steady supply of medium-to-high sulfur crude from the North Sea and West Africa. Brent crude, as the benchmark for these seaborne crudes, is feeling the pressure of this surplus.
As a result, the spread has structurally widened above what many traders consider the "normal" annual range of $2.50-$3.00. If this divergence continues, the spread could test the $3.50 resistance level—a threshold that has historically triggered arbitrage flows and prompted OPEC+ to readjust its policies.
The widening price spread presents a policy dilemma for OPEC+. The organization's production cuts have disproportionately tightened the supply of medium-to-high sulfur crude oil, which is preferred by Asian refineries, thus supporting the Brent premium. However, the surplus of light, low-sulfur European crude oil (which competes more directly with WTI) indicates that the production cuts have not been evenly distributed across different grades.
Saudi Arabia recently lowered its official selling price (OSP) for Asian buyers by $0.30 per barrel, a move interpreted by the market as a defensive measure to maintain market share. However, this also indicates that the Kingdom is aware of the widening inventory gap. If the WTI-Brent price spread continues to widen, it could incentivize the US to export crude oil to Europe, effectively circumventing OPEC+ production cuts.
The next OPEC+ meeting is scheduled for early July, at which time this structural imbalance needs to be addressed. Continuing existing production cuts could keep price spreads high, while larger cuts—especially for light, low-sulfur grades—could compress them. The market is currently pricing in a 60% probability of continued production cuts, but inventory data suggests a more nuanced policy path may be needed.
From a technical perspective, the spread is approaching a key level. Currently, it's around $3.40, near the 50-day moving average ($3.35). A break above this level would target $3.60—an area that has acted as resistance since mid-April. Support is established at $2.80, and a break below $2.50 would indicate a return to pre-production cut equilibrium levels.
Scenario 1: The price spread widens to above $3.50. This requires continued destocking at Cushing and continued inventory accumulation in ARA. Catalysts include unexpected refinery shutdowns in the US or a heat wave in Europe increasing demand for natural gas from the power sector (indirectly putting pressure on crude oil). In this scenario, WTI may test the $91.00 resistance level, while Brent will struggle to hold $93.00.
Scenario 2: The spread narrows to $2.80. This would be triggered by OPEC+ signaling increased production of light, sweet crude oil or an unexpected decline in European inventories. A weaker dollar could also boost demand for Brent-priced crude. In this scenario, WTI could retreat to the $87.50 support level, and Brent could fall to $90.30.
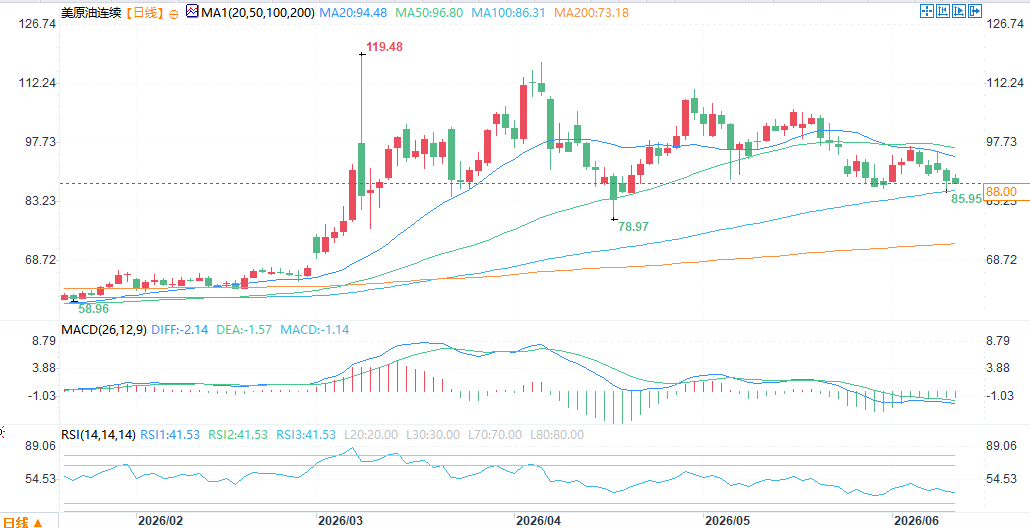
(US crude oil futures daily chart, source: FX678)
At 16:06 Beijing time on June 10, US crude oil futures were trading at $88.30 per barrel.
US Cushing inventories continued to decline due to high refinery utilization rates and export demand, while inventories in the European ARA hub accumulated for three consecutive weeks due to refinery maintenance and ample spot supply. This structural divergence is testing OPEC+'s production discipline. If the price spread widens further to above $3.50, it could trigger arbitrage flows and force OPEC+ to recalibrate its policies.
Inventory Story: Cushing Inventory Reduction vs. ARA Inventory Accumulation
The fundamentals of the spot market are telling two very different stories.
In the United States, inventories at Cushing, Oklahoma, the delivery point for WTI crude futures, have fallen sharply over the past two weeks, primarily driven by high refinery utilization rates and export demand for light, sweet crude. Although overall U.S. crude oil inventories remain near their five-year average, the tightening inventory at the delivery hub has provided a floor for WTI.
Across the Atlantic, the situation is quite different. Crude oil inventories at the Amsterdam-Rotterdam-Antwerp (ARA) hub have increased for the third consecutive week, and floating storage near the European coast is also rising. This surplus reflects weak demand from European refineries during the maintenance season, as well as a steady supply of medium-to-high sulfur crude from the North Sea and West Africa. Brent crude, as the benchmark for these seaborne crudes, is feeling the pressure of this surplus.
As a result, the spread has structurally widened above what many traders consider the "normal" annual range of $2.50-$3.00. If this divergence continues, the spread could test the $3.50 resistance level—a threshold that has historically triggered arbitrage flows and prompted OPEC+ to readjust its policies.
OPEC+ at a crossroads
The widening price spread presents a policy dilemma for OPEC+. The organization's production cuts have disproportionately tightened the supply of medium-to-high sulfur crude oil, which is preferred by Asian refineries, thus supporting the Brent premium. However, the surplus of light, low-sulfur European crude oil (which competes more directly with WTI) indicates that the production cuts have not been evenly distributed across different grades.
Saudi Arabia recently lowered its official selling price (OSP) for Asian buyers by $0.30 per barrel, a move interpreted by the market as a defensive measure to maintain market share. However, this also indicates that the Kingdom is aware of the widening inventory gap. If the WTI-Brent price spread continues to widen, it could incentivize the US to export crude oil to Europe, effectively circumventing OPEC+ production cuts.
The next OPEC+ meeting is scheduled for early July, at which time this structural imbalance needs to be addressed. Continuing existing production cuts could keep price spreads high, while larger cuts—especially for light, low-sulfur grades—could compress them. The market is currently pricing in a 60% probability of continued production cuts, but inventory data suggests a more nuanced policy path may be needed.
Technical Positions and Scenario Analysis
From a technical perspective, the spread is approaching a key level. Currently, it's around $3.40, near the 50-day moving average ($3.35). A break above this level would target $3.60—an area that has acted as resistance since mid-April. Support is established at $2.80, and a break below $2.50 would indicate a return to pre-production cut equilibrium levels.
Scenario 1: The price spread widens to above $3.50. This requires continued destocking at Cushing and continued inventory accumulation in ARA. Catalysts include unexpected refinery shutdowns in the US or a heat wave in Europe increasing demand for natural gas from the power sector (indirectly putting pressure on crude oil). In this scenario, WTI may test the $91.00 resistance level, while Brent will struggle to hold $93.00.
Scenario 2: The spread narrows to $2.80. This would be triggered by OPEC+ signaling increased production of light, sweet crude oil or an unexpected decline in European inventories. A weaker dollar could also boost demand for Brent-priced crude. In this scenario, WTI could retreat to the $87.50 support level, and Brent could fall to $90.30.
(US crude oil futures daily chart, source: FX678)
At 16:06 Beijing time on June 10, US crude oil futures were trading at $88.30 per barrel.
- Risk Warning and Disclaimer
- The market involves risk, and trading may not be suitable for all investors. This article is for reference only and does not constitute personal investment advice, nor does it take into account certain users’ specific investment objectives, financial situation, or other needs. Any investment decisions made based on this information are at your own risk.