Analysts: Short-term gold price plunge does not change the long-term bullish trend; awaiting catalysts for a market reversal.
2026-06-11 12:06:12
International gold prices have weakened recently, breaking below the key technical support level of the 200-day moving average, opening up further downside potential. Spot gold prices have fallen to around $4,023 per ounce. Influenced by a strong US job market and continued rising inflation, the market has formed a consensus expectation of persistently high interest rates, pushing up the US dollar and US Treasury yields, which continues to suppress gold prices.
Ole Hansen, head of commodity strategy at Saxo Bank, analyzed that gold is clearly under pressure in the short term, but the medium- to long-term fundamental support remains unshaken. This round of correction is only a phase adjustment in the bull market, and there are clear triggering conditions for a market reversal.
Ole Hansen released his latest market analysis on Tuesday (June 9), pointing out that gold prices breaking below the 200-day moving average is not merely a technical breakdown, but a significant signal of a shift in the market's dominant logic. He stated that the core logic behind gold's long-term upward trend remains valid, but since mid-April, the market's main trading theme has fundamentally changed. Influenced by inflation fears triggered by rising energy prices, investors are no longer focusing on long-term positive factors such as central bank reserves and debt risks, but instead are closely watching short-term negative factors such as rising oil prices, warming inflation expectations, rising US Treasury yields, and a stronger dollar.

The ongoing stalemate in US-Iran negotiations and regional tensions continue to threaten the global energy supply chain, further solidifying the risk of high inflation. This high-inflation environment is forcing the market to reinforce expectations of prolonged high interest rates from the Federal Reserve, significantly reducing the scope for monetary policy easing and thoroughly weakening the short-term investment value of gold as a non-interest-bearing asset. This has become the core reason for the continued decline in gold prices.
The 200-day moving average is a core reference indicator for determining the medium- to long-term trend of assets in the capital market, and is widely used by quantitative funds and trend traders for position control and risk assessment. Hansen stated that if gold prices continue to fall below this moving average, it will trigger institutional algorithmic selling, while simultaneously discouraging most trend-following investors from entering the market, further amplifying the short-term decline.
Gold prices have fallen from their high of around $5,600 this year. Although the short-term decline is significant, from a long-term technical perspective, it is still a mild correction within a major bull market and has not changed the overall upward trend.
As gold prices continue to adjust, the market's earlier optimism has largely subsided. Data shows that gold ETF holdings have decreased by a cumulative 88 tons this year, with current total holdings at 3,048 tons, although the overall holding size is still higher than the same period last year. Speculative net long positions in gold futures on the New York Mercantile Exchange have rebounded slightly after falling to a two-year low, with asset management institutions currently holding approximately 171,000 net long contracts. While this is an increase from recent lows, it remains below the year-to-date average, indicating that overall market sentiment is becoming more cautious.
Market volatility has declined and trading margin requirements have been lowered, but gold prices still lack upward momentum, and the downward trend that began in March has not yet been reversed.
From a technical perspective, gold needs to hold above $4,500 per ounce and further break through the 50-day moving average near $4,600 in order to fully recover from its weakness and restart its upward trend.
The market's current focus is on the first policy meeting chaired by newly appointed Federal Reserve Chairman Kevin Warsh. The policy statements made at this meeting will directly impact short-term interest rates and gold prices. Hansen believes that inflation concerns will continue to dominate the market in the short term, and gold prices are likely to maintain a weak and volatile trend.
From a long-term perspective, key positive factors such as global central bank reserve diversification, high government debt, currency devaluation risks, and fragmented geopolitical landscape remain constant.
The key catalyst for the market reversal lies in the easing of regional tensions and the return of the energy market to normalcy. Once inflationary pressures subside, the market will refocus on gold's safe-haven and value-preserving attributes, and a long-term bull market will resume.
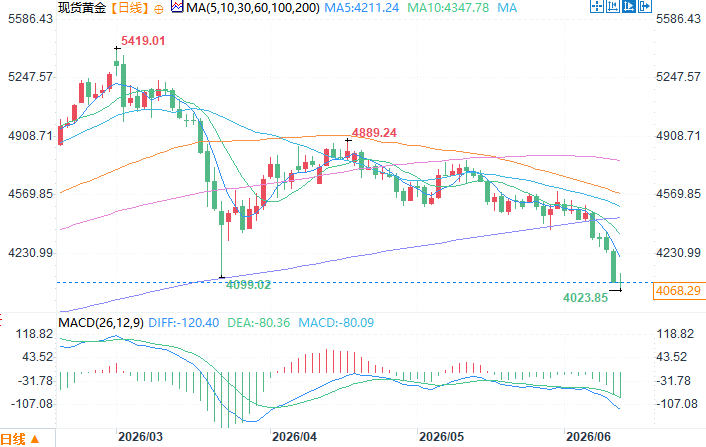
Spot gold daily chart source: EasyForex
At 12:05 Beijing time on June 11, spot gold was trading at $4071.29 per ounce.
Ole Hansen, head of commodity strategy at Saxo Bank, analyzed that gold is clearly under pressure in the short term, but the medium- to long-term fundamental support remains unshaken. This round of correction is only a phase adjustment in the bull market, and there are clear triggering conditions for a market reversal.
The market logic has completely shifted, with energy inflation dominating short-term gold price movements.
Ole Hansen released his latest market analysis on Tuesday (June 9), pointing out that gold prices breaking below the 200-day moving average is not merely a technical breakdown, but a significant signal of a shift in the market's dominant logic. He stated that the core logic behind gold's long-term upward trend remains valid, but since mid-April, the market's main trading theme has fundamentally changed. Influenced by inflation fears triggered by rising energy prices, investors are no longer focusing on long-term positive factors such as central bank reserves and debt risks, but instead are closely watching short-term negative factors such as rising oil prices, warming inflation expectations, rising US Treasury yields, and a stronger dollar.
The ongoing stalemate in US-Iran negotiations and regional tensions continue to threaten the global energy supply chain, further solidifying the risk of high inflation. This high-inflation environment is forcing the market to reinforce expectations of prolonged high interest rates from the Federal Reserve, significantly reducing the scope for monetary policy easing and thoroughly weakening the short-term investment value of gold as a non-interest-bearing asset. This has become the core reason for the continued decline in gold prices.
The break below key moving averages has triggered a period of consolidation in gold prices.
The 200-day moving average is a core reference indicator for determining the medium- to long-term trend of assets in the capital market, and is widely used by quantitative funds and trend traders for position control and risk assessment. Hansen stated that if gold prices continue to fall below this moving average, it will trigger institutional algorithmic selling, while simultaneously discouraging most trend-following investors from entering the market, further amplifying the short-term decline.
Gold prices have fallen from their high of around $5,600 this year. Although the short-term decline is significant, from a long-term technical perspective, it is still a mild correction within a major bull market and has not changed the overall upward trend.
Market sentiment cooled, and speculative positions gradually returned to rationality.
As gold prices continue to adjust, the market's earlier optimism has largely subsided. Data shows that gold ETF holdings have decreased by a cumulative 88 tons this year, with current total holdings at 3,048 tons, although the overall holding size is still higher than the same period last year. Speculative net long positions in gold futures on the New York Mercantile Exchange have rebounded slightly after falling to a two-year low, with asset management institutions currently holding approximately 171,000 net long contracts. While this is an increase from recent lows, it remains below the year-to-date average, indicating that overall market sentiment is becoming more cautious.
Market volatility has declined and trading margin requirements have been lowered, but gold prices still lack upward momentum, and the downward trend that began in March has not yet been reversed.
From a technical perspective, gold needs to hold above $4,500 per ounce and further break through the 50-day moving average near $4,600 in order to fully recover from its weakness and restart its upward trend.
Market Outlook: Short-term pressure, but a solid foundation for a long-term bull market.
The market's current focus is on the first policy meeting chaired by newly appointed Federal Reserve Chairman Kevin Warsh. The policy statements made at this meeting will directly impact short-term interest rates and gold prices. Hansen believes that inflation concerns will continue to dominate the market in the short term, and gold prices are likely to maintain a weak and volatile trend.
From a long-term perspective, key positive factors such as global central bank reserve diversification, high government debt, currency devaluation risks, and fragmented geopolitical landscape remain constant.
The key catalyst for the market reversal lies in the easing of regional tensions and the return of the energy market to normalcy. Once inflationary pressures subside, the market will refocus on gold's safe-haven and value-preserving attributes, and a long-term bull market will resume.
Spot gold daily chart source: EasyForex
At 12:05 Beijing time on June 11, spot gold was trading at $4071.29 per ounce.
- Risk Warning and Disclaimer
- The market involves risk, and trading may not be suitable for all investors. This article is for reference only and does not constitute personal investment advice, nor does it take into account certain users’ specific investment objectives, financial situation, or other needs. Any investment decisions made based on this information are at your own risk.