Silver Market Outlook: Negative Factors Have Been Fully Digested, and Silver May See a Rebound?
2026-06-12 00:34:34
On Thursday (June 11), spot silver was trading at $64.225 during the US session, up 1.33%. Earlier this week, silver prices had already fallen sharply ahead of the release of CPI and PPI data, as traders had priced in negative data in advance.
Wednesday's CPI data showed inflation exceeding 4%, and Thursday's PPI data also significantly exceeded expectations. On the same day, the European Central Bank announced an interest rate hike. A series of negative factors emerged this week.
On the day a series of negative data were released, silver not only stabilized but also rose slightly. When negative expectations are fully priced in but prices fail to continue falling, it indicates that the bearish momentum has been exhausted, and Thursday's market movement was precisely this signal.
Overall, PPI data is strong, but the detailed data suggests a potential turning point.
The producer price index (PPI) rose 1.1% month-on-month in May, far exceeding market expectations of 0.7%; wholesale prices rose 6.5% year-on-year, reaching a new high since November 2022. Overall, the inflation situation appears concerning, but the detailed indicators are not so pessimistic.
Nearly 80% of the month-on-month increase in PPI came from a 2.8% surge in final demand goods prices, with energy products being the main driver: wholesale gasoline prices jumped 23.4% in a single month, and overall energy costs climbed 10.7% month-on-month. Tensions in Iran directly pushed up energy prices, a factor that also influenced the previously released CPI data.
The core PPI, excluding food and energy, rose 0.4% month-on-month, lower than the market expectation of 0.5%. This indicator is particularly crucial for silver prices, as it determines whether inflationary pressures are limited to the energy sector or have spread widely. Currently, inflationary pressures have not spread extensively. While inflation data appears high, the price increases are primarily concentrated in energy categories such as crude oil and gasoline, rather than due to overall overheated market demand.
CPI data confirms: The Federal Reserve is unlikely to cut interest rates in the near term.
Wednesday's CPI data showed that US inflation rose to 4.2% year-on-year, a near three-year high; core prices rose only 0.2% month-on-month, with core inflation at 2.9% year-on-year. Against this backdrop, the Federal Reserve is unlikely to cut interest rates. The market widely expects the Federal Open Market Committee (FOMC) to keep interest rates unchanged at next week's meeting. Surveys show that most economists believe the Fed will not cut rates for the remainder of the year.
Market expectations for interest rate cuts have completely subsided, with some traders even betting on a possible rate hike by the Federal Reserve this year. Generally speaking, a combination of high inflation and persistently high interest rates is very unfavorable for silver. Silver itself does not generate interest income, and when US Treasury yields rise, various interest-bearing assets become far more attractive than silver.
This week, silver prices had already fallen before the data release. When the negative data materialized as expected, prices stopped declining, demonstrating that the market had already priced in the negative expectations related to interest rates.
Despite the European Central Bank's interest rate hike, silver prices remained resilient.
The European Central Bank (ECB) raised interest rates by 25 basis points on Thursday, increasing the deposit rate to 2.25%, its first rate hike since 2023. European policymakers are concerned that energy-driven inflation will gradually spread to prices across all categories. Markets have already anticipated further monetary tightening by the ECB later this year.
The simultaneous tightening of monetary policy by the two major central banks should theoretically put downward pressure on silver: this move would push up global bond yields and boost mainstream currencies, and silver, as a non-interest-bearing asset, should have been under pressure. However, in reality, despite multiple negative factors converging—the Federal Reserve's hawkish stance, the European Central Bank's interest rate hike, and record-breaking PPI data—silver actually rose on that day. This is because the market's selling pressure in response to these negative factors had already been completed earlier this week.
Technical Analysis
Silver prices fluctuated slightly lower on Thursday, with signs of bottoming out in the short term.
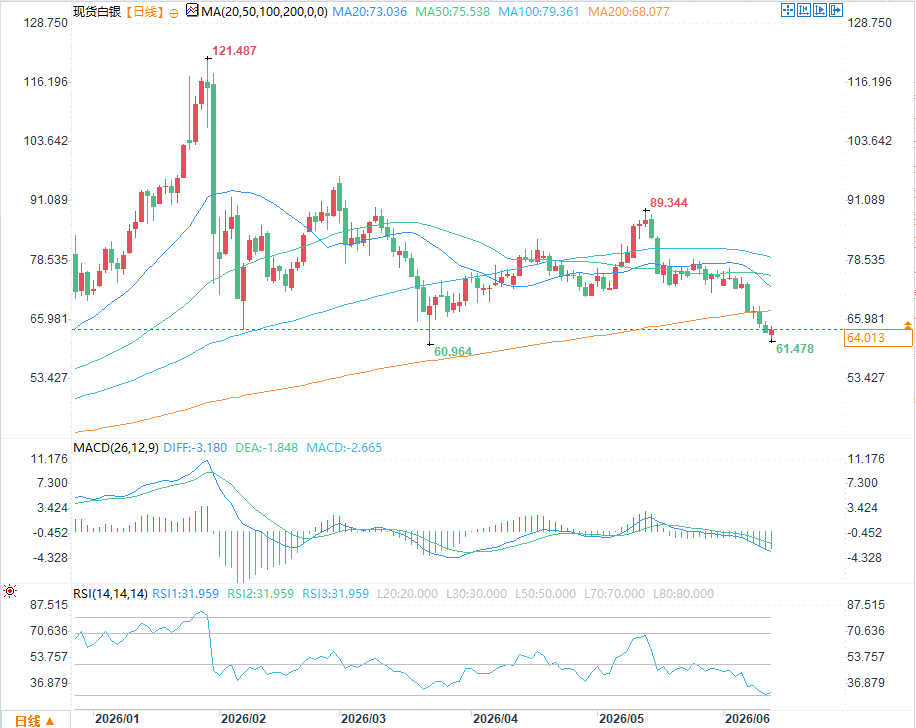
(Spot silver daily chart source: EasyTrade)
Based on a comprehensive assessment using long-term and short-term trend indicators, as well as the 50-day and 200-day moving averages, silver is currently in a downward trend in both the medium-to-long-term and short-term. The current trend direction is quite clear; our focus is now on support levels and whether the downtrend will continue.
resistance level
The first resistance level is the 200-day moving average at $68.08. If the price successfully breaks through this level, short covering may push silver prices higher, with the next resistance zone being the combined resistance area formed by the 20-day moving average at $73.04 and the 50-day moving average at $75.54.
support level
The primary downside target in the short term is the latest low of $61.48 in this round of decline, followed by the low of $60.96 on March 23. The price level that the market was really targeting before was the 50% retracement of the historical high of $121.49, which is approximately $60.74, roughly coinciding with $60.96.
$59.34 is another key support level, which was broken on December 5th of last year, triggering a major rally from December to January of the following year. A break below $59.34 would open up further downside potential for silver, with the next strong support level to be traced back to the major low of $45.55 on October 28th.
During a rapid market decline, blindly buying the dip is not recommended. Only small positions can be attempted at key price levels like $61.00. In a prolonged downtrend, the most reliable bottoming signal is usually a significant reversal candlestick pattern.
Key points to watch in the market outlook
This week, the market sold off silver in anticipation of the CPI and PPI data. Both figures indicated overall inflation was high, but primarily driven by energy price increases stemming from the situation in Iran; core inflation data fell short of market expectations. The Federal Reserve confirmed it has no plans to cut interest rates, and the European Central Bank completed its rate hike; these negative factors had already been priced into the market before the data release.
After a series of negative factors were priced in, silver bucked the trend and rose, indicating that short sellers no longer had the incentive to sell further.
From a technical perspective, the MACD DIFF line is still running below the DEA line, and the green bars have not yet shown a significant reduction in volume, indicating that downward momentum is still being released. The RSI indicator is approaching the oversold zone of 30, which increases the possibility of a short-term technical rebound, but there is no clear bottom divergence or reversal signal yet.
Overall assessment: On the road to a silver price rebound, $68.08 (200-day moving average) is the first major test. If only short covering occurs, the price will likely stop at the $73.04–$75.54 resistance zone; only substantial buying interest can sustain the upward trend in silver prices.
On the downside, pay close attention to the two key levels of $61.48 and $60.96. A break below $59.34 would trigger a sharp decline, with the next strong support level at $45.55.
This round of decline had already priced in the negative news, and prices stabilized after the data was released, which is a typical start to the market bottoming out. Whether the bottom can be definitively established depends on the outcome of next week's FOMC meeting and whether the Federal Reserve releases a more hawkish policy signal than the market expects.
Wednesday's CPI data showed inflation exceeding 4%, and Thursday's PPI data also significantly exceeded expectations. On the same day, the European Central Bank announced an interest rate hike. A series of negative factors emerged this week.
On the day a series of negative data were released, silver not only stabilized but also rose slightly. When negative expectations are fully priced in but prices fail to continue falling, it indicates that the bearish momentum has been exhausted, and Thursday's market movement was precisely this signal.
Overall, PPI data is strong, but the detailed data suggests a potential turning point.
The producer price index (PPI) rose 1.1% month-on-month in May, far exceeding market expectations of 0.7%; wholesale prices rose 6.5% year-on-year, reaching a new high since November 2022. Overall, the inflation situation appears concerning, but the detailed indicators are not so pessimistic.
Nearly 80% of the month-on-month increase in PPI came from a 2.8% surge in final demand goods prices, with energy products being the main driver: wholesale gasoline prices jumped 23.4% in a single month, and overall energy costs climbed 10.7% month-on-month. Tensions in Iran directly pushed up energy prices, a factor that also influenced the previously released CPI data.
The core PPI, excluding food and energy, rose 0.4% month-on-month, lower than the market expectation of 0.5%. This indicator is particularly crucial for silver prices, as it determines whether inflationary pressures are limited to the energy sector or have spread widely. Currently, inflationary pressures have not spread extensively. While inflation data appears high, the price increases are primarily concentrated in energy categories such as crude oil and gasoline, rather than due to overall overheated market demand.
CPI data confirms: The Federal Reserve is unlikely to cut interest rates in the near term.
Wednesday's CPI data showed that US inflation rose to 4.2% year-on-year, a near three-year high; core prices rose only 0.2% month-on-month, with core inflation at 2.9% year-on-year. Against this backdrop, the Federal Reserve is unlikely to cut interest rates. The market widely expects the Federal Open Market Committee (FOMC) to keep interest rates unchanged at next week's meeting. Surveys show that most economists believe the Fed will not cut rates for the remainder of the year.
Market expectations for interest rate cuts have completely subsided, with some traders even betting on a possible rate hike by the Federal Reserve this year. Generally speaking, a combination of high inflation and persistently high interest rates is very unfavorable for silver. Silver itself does not generate interest income, and when US Treasury yields rise, various interest-bearing assets become far more attractive than silver.
This week, silver prices had already fallen before the data release. When the negative data materialized as expected, prices stopped declining, demonstrating that the market had already priced in the negative expectations related to interest rates.
Despite the European Central Bank's interest rate hike, silver prices remained resilient.
The European Central Bank (ECB) raised interest rates by 25 basis points on Thursday, increasing the deposit rate to 2.25%, its first rate hike since 2023. European policymakers are concerned that energy-driven inflation will gradually spread to prices across all categories. Markets have already anticipated further monetary tightening by the ECB later this year.
The simultaneous tightening of monetary policy by the two major central banks should theoretically put downward pressure on silver: this move would push up global bond yields and boost mainstream currencies, and silver, as a non-interest-bearing asset, should have been under pressure. However, in reality, despite multiple negative factors converging—the Federal Reserve's hawkish stance, the European Central Bank's interest rate hike, and record-breaking PPI data—silver actually rose on that day. This is because the market's selling pressure in response to these negative factors had already been completed earlier this week.
Technical Analysis
Silver prices fluctuated slightly lower on Thursday, with signs of bottoming out in the short term.
(Spot silver daily chart source: EasyTrade)
Based on a comprehensive assessment using long-term and short-term trend indicators, as well as the 50-day and 200-day moving averages, silver is currently in a downward trend in both the medium-to-long-term and short-term. The current trend direction is quite clear; our focus is now on support levels and whether the downtrend will continue.
resistance level
The first resistance level is the 200-day moving average at $68.08. If the price successfully breaks through this level, short covering may push silver prices higher, with the next resistance zone being the combined resistance area formed by the 20-day moving average at $73.04 and the 50-day moving average at $75.54.
support level
The primary downside target in the short term is the latest low of $61.48 in this round of decline, followed by the low of $60.96 on March 23. The price level that the market was really targeting before was the 50% retracement of the historical high of $121.49, which is approximately $60.74, roughly coinciding with $60.96.
$59.34 is another key support level, which was broken on December 5th of last year, triggering a major rally from December to January of the following year. A break below $59.34 would open up further downside potential for silver, with the next strong support level to be traced back to the major low of $45.55 on October 28th.
During a rapid market decline, blindly buying the dip is not recommended. Only small positions can be attempted at key price levels like $61.00. In a prolonged downtrend, the most reliable bottoming signal is usually a significant reversal candlestick pattern.
Key points to watch in the market outlook
This week, the market sold off silver in anticipation of the CPI and PPI data. Both figures indicated overall inflation was high, but primarily driven by energy price increases stemming from the situation in Iran; core inflation data fell short of market expectations. The Federal Reserve confirmed it has no plans to cut interest rates, and the European Central Bank completed its rate hike; these negative factors had already been priced into the market before the data release.
After a series of negative factors were priced in, silver bucked the trend and rose, indicating that short sellers no longer had the incentive to sell further.
From a technical perspective, the MACD DIFF line is still running below the DEA line, and the green bars have not yet shown a significant reduction in volume, indicating that downward momentum is still being released. The RSI indicator is approaching the oversold zone of 30, which increases the possibility of a short-term technical rebound, but there is no clear bottom divergence or reversal signal yet.
Overall assessment: On the road to a silver price rebound, $68.08 (200-day moving average) is the first major test. If only short covering occurs, the price will likely stop at the $73.04–$75.54 resistance zone; only substantial buying interest can sustain the upward trend in silver prices.
On the downside, pay close attention to the two key levels of $61.48 and $60.96. A break below $59.34 would trigger a sharp decline, with the next strong support level at $45.55.
This round of decline had already priced in the negative news, and prices stabilized after the data was released, which is a typical start to the market bottoming out. Whether the bottom can be definitively established depends on the outcome of next week's FOMC meeting and whether the Federal Reserve releases a more hawkish policy signal than the market expects.
- Risk Warning and Disclaimer
- The market involves risk, and trading may not be suitable for all investors. This article is for reference only and does not constitute personal investment advice, nor does it take into account certain users’ specific investment objectives, financial situation, or other needs. Any investment decisions made based on this information are at your own risk.