From a 3% plunge to a sharp rebound: Gold's changing landscape amid the US-Iran reconciliation and the Fed's tug-of-war.
2026-06-18 16:21:08
On Thursday (June 18), geopolitical optimism led to a slight rebound in spot gold, recovering about 1% of yesterday's losses. Last night, the price of gold had plunged by more than 2% due to the Fed's dot plot.
At approximately 5:00 AM Beijing time on the morning of the 18th (Tehran time), Iranian President Pezechzian and US President Trump completed the electronic signing of a ceasefire memorandum of understanding. The signing ceremony took place at a dinner hosted by Macron at the Palace of Versailles in France. Iranian President Pezechzian and US President Trump signed the document on behalf of their respective countries. Pakistani Prime Minister Sheikh Baz Sharif, the mediator, confirmed that the document would take effect immediately upon signing , and both sides would simultaneously begin a 60-day final nuclear negotiation cycle.
Trump's remarks continued to provide optimism to the market, with his statement just hours earlier claiming that a nuclear agreement could be signed within 48 hours, whereas the agreement was something that was supposed to be negotiated in 60 days.
Trump made it clear that the United States would not make concessions to Iran in terms of funds or investment. The $300 billion in reconstruction funds for Iran stipulated in the agreement will be entirely funded by a consortium of Gulf Arab states. The disbursement of funds will be directly linked to Iran's performance in fulfilling the agreement. This record-breaking reconstruction fund will only be disbursed gradually as Iran continues to fulfill its obligations under the agreement.
Trump also predicted that, due to the long-term effects of sanctions, Iran's complete reconstruction cycle would take 15 to 20 years.
Regarding the frozen Iranian assets overseas, Trump signaled a more lenient stance: "This money belongs to Iran, and we will return it when the time is right."
The core consideration is that if other countries' overseas assets are detained for a long time, it will seriously shake the confidence of countries around the world in using the US dollar for cross-border investment and damage the foundation of the dollar's hegemony. Of course, this is basically a way to save face for themselves.
In the sensitive area of ballistic missiles, Trump changed his previous hardline stance, saying, "It's a little unfair that other countries have ballistic missiles but Iran doesn't have a single one."
This statement significantly relaxed the US's previous position that demanded Iran completely dismantle its missile system, becoming an important compromise point in the agreement.
The agreement explicitly requires Iran to dilute its stockpile of highly enriched uranium, with the International Atomic Energy Agency overseeing the dilution process throughout. In return, the US will temporarily lift sanctions waivers on Iranian crude oil exports.
However, Trump has always maintained a "safety valve": the document is only a non-binding memorandum of understanding, and if Iran fails to meet expectations, the US can restart airstrikes at any time.
It is worth noting that this interim agreement did not achieve the operational goals previously claimed by the US, such as "dismantling Iran's nuclear and missile systems and regime change." It not only triggered opposition from both parties in the US, but Israel also explicitly rejected the requirement in the agreement for "Israeli troops to withdraw from Lebanon," thus creating potential problems for the final negotiations in the following 60 days.
After the agreement was implemented, shipping in the Strait of Hormuz recovered rapidly.
Trump publicly confirmed that "traffic in the Strait has increased ." Ship tracking data shows that the two Saudi supertankers, Shaden and Jaham (carrying a total of 4.2 million barrels of crude oil), which had been out of contact for nearly two months, have re-signed off the coast of Fujairah in the Gulf of Oman, marking the gradual return of crude oil transportation in the Persian Gulf to normal.
Middle Eastern oil-producing countries are taking simultaneous action: Iraq's Ministry of Oil has initiated the tanker allocation process, overseas buyers are submitting loading applications in large numbers, and Basra Oil Company predicts that crude oil production in the south will increase further as loading progresses.
The agreement stipulates that shipping in the strait will be restored to pre-war levels within 30 days, and navigation fees will be waived for the first two months. The US will simultaneously lift the maritime blockade of Iranian ports, and normalized navigation can be achieved simply by clearing mines from the waterways.
Just as the reconciliation between the US and Iran eased geopolitical risks, the Federal Reserve's interest rate meeting in the early hours of the morning released an unexpectedly hawkish signal.
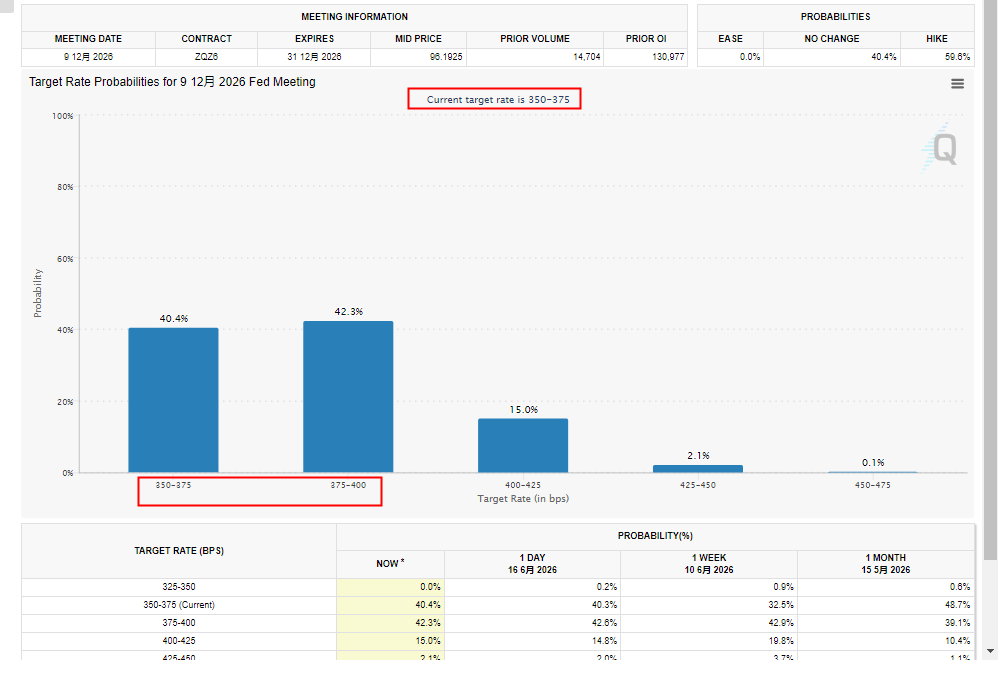
(The probability of a rate hike before the end of the year was less than 61% before the Fed's press conference. Source: CME Group)
Despite the benchmark interest rate remaining unchanged, the latest dot plot shows that 6 out of 18 officials marked "two rate hikes this year" in pencil, and 9 supported at least one rate hike, a complete reversal from the expectations at the March meeting.
As a result, the implied probability of a year-end rate hike in December interest rate futures surged from 61% to over 80%, and US Treasury yields strengthened in tandem with the US dollar.
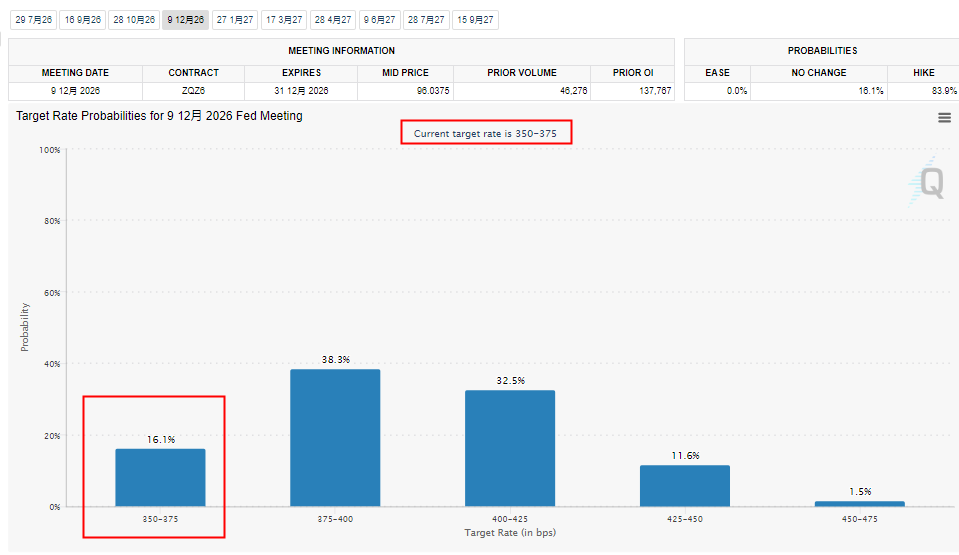
(Following the Fed's press conference, the probability of a rate hike before the end of the year is approximately 84%. Source: CME Group)
However, Federal Reserve Chairman Warsh later downplayed the issue, stating that "these dot plots were done with pencils that had erasers on the back," implying that the committee members' interest rate decisions were not fixed commitments and would be adjusted flexibly according to economic data, suggesting that the actual probability of consecutive rate hikes this year was limited.
In the short term, the easing of the risk premium on crude oil due to the US-Iran reconciliation has weakened inflation concerns, and the decline in real interest rates is beneficial to gold prices. However, the hawkish stance of the Fed's dot plot has boosted expectations of interest rate hikes, and the rise in the dollar and US Treasury yields have led to a sharp drop in gold prices. The dollar index has now broken through the key level of 100, and the reasons behind this are worth noting, as there may be other factors as well.
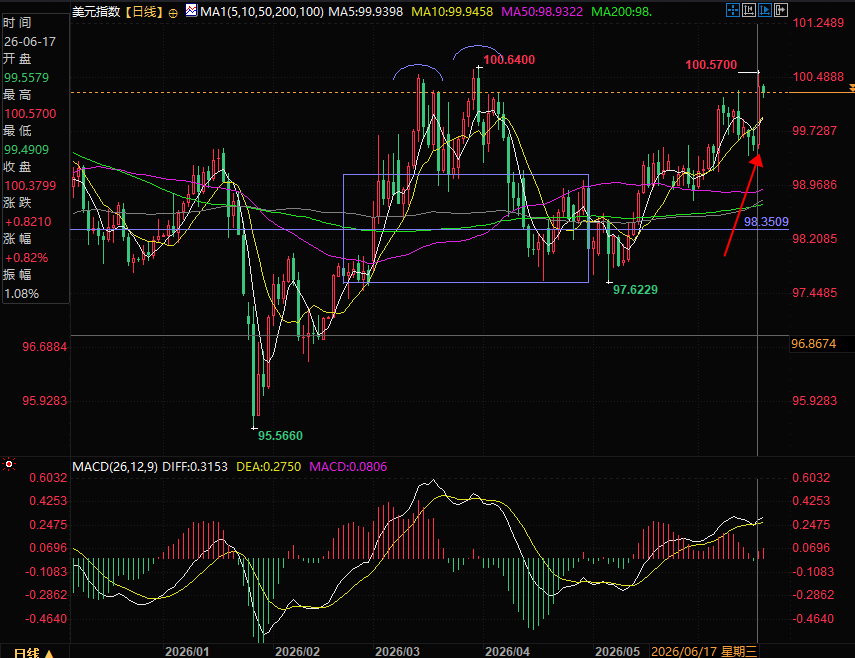
(US Dollar Index Daily Chart, Source: FX678)
From a medium- to long-term perspective, the de-emphasis on the dot plot by Walsh and the easing of energy inflation pressures will gradually offset hawkish policy expectations and provide support for gold prices. However, the high capital expenditure on AI in the US as a whole, resulting in persistently high Treasury yields, and the substitution effect of assets chasing high-yield financial products for gold purchases will be long-term obstacles to the rise in gold prices.
From a technical perspective, spot gold is still trading within a descending channel, currently retracing to the middle line of the channel while battling for support at the 5-day moving average.
Support remains at the 5-day moving average and the middle line of the channel, while resistance is at the upper line of the channel and around 4350.
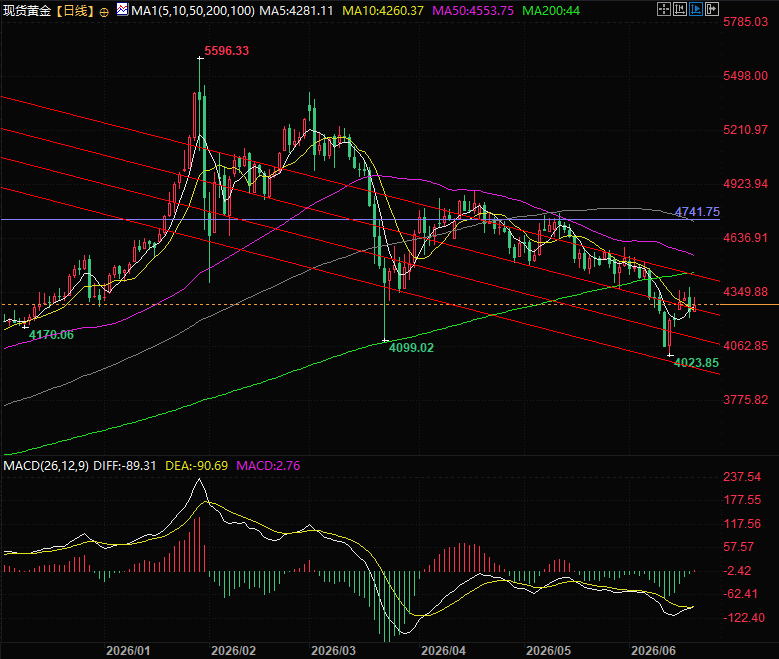
(Spot gold daily chart, source: FX678)
At 16:17 Beijing time, spot gold is trading at $4,289 per ounce, and the US dollar index is currently at 100.37.
At approximately 5:00 AM Beijing time on the morning of the 18th (Tehran time), Iranian President Pezechzian and US President Trump completed the electronic signing of a ceasefire memorandum of understanding. The signing ceremony took place at a dinner hosted by Macron at the Palace of Versailles in France. Iranian President Pezechzian and US President Trump signed the document on behalf of their respective countries. Pakistani Prime Minister Sheikh Baz Sharif, the mediator, confirmed that the document would take effect immediately upon signing , and both sides would simultaneously begin a 60-day final nuclear negotiation cycle.
Trump's remarks continued to provide optimism to the market, with his statement just hours earlier claiming that a nuclear agreement could be signed within 48 hours, whereas the agreement was something that was supposed to be negotiated in 60 days.
The US made multiple concessions: flexible statements regarding funding, missiles, and asset freezes.
Trump made it clear that the United States would not make concessions to Iran in terms of funds or investment. The $300 billion in reconstruction funds for Iran stipulated in the agreement will be entirely funded by a consortium of Gulf Arab states. The disbursement of funds will be directly linked to Iran's performance in fulfilling the agreement. This record-breaking reconstruction fund will only be disbursed gradually as Iran continues to fulfill its obligations under the agreement.
Trump also predicted that, due to the long-term effects of sanctions, Iran's complete reconstruction cycle would take 15 to 20 years.
Regarding the frozen Iranian assets overseas, Trump signaled a more lenient stance: "This money belongs to Iran, and we will return it when the time is right."
The core consideration is that if other countries' overseas assets are detained for a long time, it will seriously shake the confidence of countries around the world in using the US dollar for cross-border investment and damage the foundation of the dollar's hegemony. Of course, this is basically a way to save face for themselves.
In the sensitive area of ballistic missiles, Trump changed his previous hardline stance, saying, "It's a little unfair that other countries have ballistic missiles but Iran doesn't have a single one."
This statement significantly relaxed the US's previous position that demanded Iran completely dismantle its missile system, becoming an important compromise point in the agreement.
Nuclear Issues: Monitoring and Countermeasures Go Hand in Hand, Agreement Still Uncertain
The agreement explicitly requires Iran to dilute its stockpile of highly enriched uranium, with the International Atomic Energy Agency overseeing the dilution process throughout. In return, the US will temporarily lift sanctions waivers on Iranian crude oil exports.
However, Trump has always maintained a "safety valve": the document is only a non-binding memorandum of understanding, and if Iran fails to meet expectations, the US can restart airstrikes at any time.
It is worth noting that this interim agreement did not achieve the operational goals previously claimed by the US, such as "dismantling Iran's nuclear and missile systems and regime change." It not only triggered opposition from both parties in the US, but Israel also explicitly rejected the requirement in the agreement for "Israeli troops to withdraw from Lebanon," thus creating potential problems for the final negotiations in the following 60 days.
With shipping activity in the Strait of Hormuz recovering, preparations for Middle Eastern crude oil exports are accelerating.
After the agreement was implemented, shipping in the Strait of Hormuz recovered rapidly.
Trump publicly confirmed that "traffic in the Strait has increased ." Ship tracking data shows that the two Saudi supertankers, Shaden and Jaham (carrying a total of 4.2 million barrels of crude oil), which had been out of contact for nearly two months, have re-signed off the coast of Fujairah in the Gulf of Oman, marking the gradual return of crude oil transportation in the Persian Gulf to normal.
Middle Eastern oil-producing countries are taking simultaneous action: Iraq's Ministry of Oil has initiated the tanker allocation process, overseas buyers are submitting loading applications in large numbers, and Basra Oil Company predicts that crude oil production in the south will increase further as loading progresses.
The agreement stipulates that shipping in the strait will be restored to pre-war levels within 30 days, and navigation fees will be waived for the first two months. The US will simultaneously lift the maritime blockade of Iranian ports, and normalized navigation can be achieved simply by clearing mines from the waterways.
The Federal Reserve has made a major policy reversal: the dot plot has become significantly more hawkish, but the chairman has hinted that it's not as hawkish as it seems.
Just as the reconciliation between the US and Iran eased geopolitical risks, the Federal Reserve's interest rate meeting in the early hours of the morning released an unexpectedly hawkish signal.
(The probability of a rate hike before the end of the year was less than 61% before the Fed's press conference. Source: CME Group)
Despite the benchmark interest rate remaining unchanged, the latest dot plot shows that 6 out of 18 officials marked "two rate hikes this year" in pencil, and 9 supported at least one rate hike, a complete reversal from the expectations at the March meeting.
As a result, the implied probability of a year-end rate hike in December interest rate futures surged from 61% to over 80%, and US Treasury yields strengthened in tandem with the US dollar.
(Following the Fed's press conference, the probability of a rate hike before the end of the year is approximately 84%. Source: CME Group)
However, Federal Reserve Chairman Warsh later downplayed the issue, stating that "these dot plots were done with pencils that had erasers on the back," implying that the committee members' interest rate decisions were not fixed commitments and would be adjusted flexibly according to economic data, suggesting that the actual probability of consecutive rate hikes this year was limited.
Summary and Technical Analysis:
In the short term, the easing of the risk premium on crude oil due to the US-Iran reconciliation has weakened inflation concerns, and the decline in real interest rates is beneficial to gold prices. However, the hawkish stance of the Fed's dot plot has boosted expectations of interest rate hikes, and the rise in the dollar and US Treasury yields have led to a sharp drop in gold prices. The dollar index has now broken through the key level of 100, and the reasons behind this are worth noting, as there may be other factors as well.
(US Dollar Index Daily Chart, Source: FX678)
From a medium- to long-term perspective, the de-emphasis on the dot plot by Walsh and the easing of energy inflation pressures will gradually offset hawkish policy expectations and provide support for gold prices. However, the high capital expenditure on AI in the US as a whole, resulting in persistently high Treasury yields, and the substitution effect of assets chasing high-yield financial products for gold purchases will be long-term obstacles to the rise in gold prices.
From a technical perspective, spot gold is still trading within a descending channel, currently retracing to the middle line of the channel while battling for support at the 5-day moving average.
Support remains at the 5-day moving average and the middle line of the channel, while resistance is at the upper line of the channel and around 4350.
(Spot gold daily chart, source: FX678)
At 16:17 Beijing time, spot gold is trading at $4,289 per ounce, and the US dollar index is currently at 100.37.
- Risk Warning and Disclaimer
- The market involves risk, and trading may not be suitable for all investors. This article is for reference only and does not constitute personal investment advice, nor does it take into account certain users’ specific investment objectives, financial situation, or other needs. Any investment decisions made based on this information are at your own risk.