Why did oil prices fall instead of rise despite inventories falling for ten consecutive weeks to a 40-year low?
2026-06-18 16:33:32
On Thursday (June 18) during the European session, WTI crude oil prices continued to decline, pressured by optimistic expectations of a US-Iran peace agreement and the potential reopening of the Strait of Hormuz. Oil prices fell to a three-month low of $73.42 per barrel at one point, and are currently trading around $74.30 per barrel. The cumulative decline this week is about 10%.

The core trigger for this round of sharp oil price decline was the formal implementation of the US-Iran peace agreement, which completely reversed previous market expectations of geopolitical tensions in the Middle East and disruptions to energy supplies. US President Trump reached a peace agreement with Iran at the Palace of Versailles in France on Wednesday, and the official details of the cooperation were released, clarifying that the Strait of Hormuz will achieve safe, free, and regular navigation.
In return, the United States will lift sanctions on Iranian oil, unfreeze Iranian funds frozen overseas, and allocate a $300 billion war reconstruction fund, thus clearing all obstacles to Iranian crude oil exports.
In addition, the Swiss Foreign Ministry confirmed on Thursday that the US and Iran will continue consultations on Friday at the Burgenstock resort to refine the details of the agreement and promote the implementation of the resumption of air traffic.
The global market quickly priced in the fading risks to Middle Eastern energy supplies, and the accumulated geopolitical risk premium for crude oil during the previous conflict was cleared out. The previously tight global crude oil supply expectations were significantly eased, and funds concentrated on selling off crude oil long positions, thereby pushing oil prices down continuously and hitting a new low for the period.
Despite strong fundamental support, oil prices continued their downward trend. Wednesday's EIA report showed a significantly positive crude oil inventory data, with U.S. commercial crude oil inventories falling by 8.26 million barrels in the week ending June 12, far exceeding market expectations of a 4.6 million barrel drop—nearly double the anticipated decline.
This marks the tenth consecutive week of decline in U.S. crude oil inventories, with the continued destocking trend bringing inventory levels to their lowest level in over forty years, fully reflecting the current tight supply and demand situation in the U.S. domestic crude oil spot market.
According to traditional trading logic, unexpected inventory reduction should provide strong support for oil prices, but this time the market reaction was extremely muted, and the positive factors completely failed.
The core reason lies in the expectation of medium- to long-term supply recovery brought about by the US-Iran agreement, which has completely dominated market pricing, and the short-term benefit of tight inventory has been completely offset.
The focus of trading has shifted from the current shortage of spot goods to the reshaping of global supply following the opening of the Strait of Hormuz and the return of Iranian crude oil. Investors anticipate that crude oil supply will remain ample, thus becoming desensitized to short-term inventory data. Bullish funds are unwilling to enter the market to take over, ultimately resulting in a divergent market trend of "positive data, sharp price drop".
Following the signing of the US-Iran memorandum of understanding, Goldman Sachs lowered its crude oil price forecast twice within a week. The core reason is that the recovery of navigation in the Strait of Hormuz is progressing much faster than previously predicted, bringing forward the timeline for the restoration of Persian Gulf crude oil exports to pre-war levels from the end of August to the end of July.
Goldman Sachs lowered its average WTI crude oil price forecast for Q4 2026 to $75 and its full-year 2027 average to $70, while simultaneously lowering its Q4 Brent target to $80. Following sanctions waivers, Iranian crude oil exports are expected to return rapidly, coupled with strong production increases from Gulf oil-producing countries like the UAE, and continued output from non-OPEC production in the Americas, leading to an earlier-than-expected global supply easing cycle. Although current US commercial crude oil inventories have declined for ten consecutive weeks and are at a 40-year low, short-term inventory tightness has been completely offset by medium- to long-term supply recovery expectations, shifting market focus to a longer-term surplus.
Goldman Sachs also warned of two-way risks in the market. If the Iran nuclear negotiations break down and the Strait of Hormuz is blocked again, oil prices could rise to above $110. If the agreement is implemented smoothly and the geopolitical premium continues to clear in the third quarter, the probability of oil prices falling to the $70 range will increase significantly. In terms of trading strategy, it is recommended not to chase the short position in the short term, but to build short positions in batches on rebounds to protect the position.
JPMorgan Chase holds a bearish view on the short-term trend of crude oil, believing that WTI could potentially test the $70 mark within weeks. The firm stated that the peace agreement between the US and Iran completely dispelled months of market panic regarding the Middle East supply crisis, and the massive geopolitical risk premium previously priced into oil prices was released in a concentrated manner, which was the core driver of this round of oil price plunges.
JPMorgan Chase estimates that over 160 million barrels of crude oil are currently stranded in the Gulf region awaiting shipment. Once shipping through the strait resumes, these barrels will continue to flow into the global market, gradually reshaping the loose supply-demand balance. Although US domestic inventories continue to decline and the summer travel season supports physical demand, the increase in supply is sufficient to cover seasonal consumption increases, making it difficult to create a sustained bullish effect.
In the medium to long term, JPMorgan Chase predicts a significant oversupply in the global oil market by 2027, with the supply-demand gap completely reversed. Meanwhile, the hawkish signals from the new Federal Reserve chairman and rising US Treasury yields are suppressing commodity valuations, further dampening bullish sentiment in the oil market.
JPMorgan Chase cautioned that there is uncertainty regarding the implementation of the agreement. If disagreements arise at the Swiss talks on Friday, a short-term rebound could occur. It is recommended to sell short on rallies within the $76-$78 resistance range, and for long-term positions, wait for the price to fall below $70 before establishing long positions.
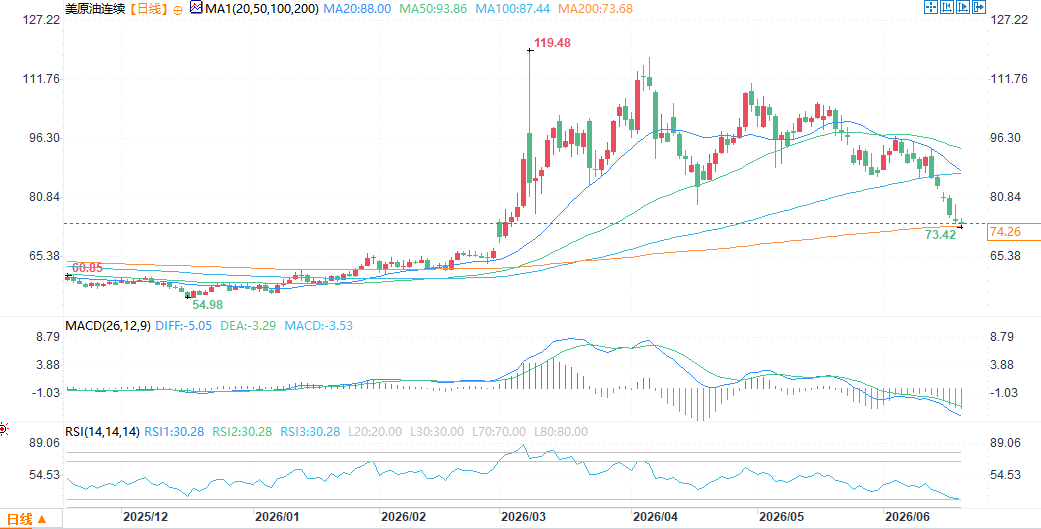
According to the daily chart, the overall downtrend in US crude oil futures is clear, with prices breaking sharply below all short- and medium-term moving averages. The 20-day moving average (MA20) (88.00), 50-day moving average (MA50) (93.86), and 100-day moving average (MA100) (87.44) have formed strong resistance levels. The core resistance zone above is $88-94, while the initial support level is $73.68. If this level is broken, the price will likely test the previous support level of $65-66.
In terms of indicators, the MACD lines continue to run below the zero axis, the DIFF is below the DEA, and the green bars continue to expand, indicating that the bearish momentum is being released. The RSI value is 30.28, which is close to the 20 oversold threshold. There is a slight need for oversold correction in the short term, but no clear bottom divergence reversal signal has appeared.
In terms of price structure, oil prices have been trending downwards since the year's high of $119.48. Recently, the price has accelerated its decline due to supply expectations following a potential truce between the US and Iran, hitting a low of $73.42 during the session. Prices have closed lower for several consecutive days, with weak rebounds; each slight recovery has been met with resistance from short-term moving averages, leading to further declines. A short-term technical rebound is possible, supported by the 200-day moving average, but the overall downtrend is unlikely to reverse quickly, limiting the upside potential. If the $73.68 support level is breached, further downside potential will open up. The overall strategy should be to sell on rallies, with only small positions available for short-term corrections near the $70 oversold level.
At 15:53 Beijing time on June 18, US crude oil futures were trading at $74.33 per barrel.
The signing of the US-Iran peace agreement and the prospect of navigation in the Strait of Hormuz are putting pressure on oil prices.
The core trigger for this round of sharp oil price decline was the formal implementation of the US-Iran peace agreement, which completely reversed previous market expectations of geopolitical tensions in the Middle East and disruptions to energy supplies. US President Trump reached a peace agreement with Iran at the Palace of Versailles in France on Wednesday, and the official details of the cooperation were released, clarifying that the Strait of Hormuz will achieve safe, free, and regular navigation.
In return, the United States will lift sanctions on Iranian oil, unfreeze Iranian funds frozen overseas, and allocate a $300 billion war reconstruction fund, thus clearing all obstacles to Iranian crude oil exports.
In addition, the Swiss Foreign Ministry confirmed on Thursday that the US and Iran will continue consultations on Friday at the Burgenstock resort to refine the details of the agreement and promote the implementation of the resumption of air traffic.
The global market quickly priced in the fading risks to Middle Eastern energy supplies, and the accumulated geopolitical risk premium for crude oil during the previous conflict was cleared out. The previously tight global crude oil supply expectations were significantly eased, and funds concentrated on selling off crude oil long positions, thereby pushing oil prices down continuously and hitting a new low for the period.
Inventories fell for ten consecutive weeks to a 40-year low, but the market reaction was muted.
Despite strong fundamental support, oil prices continued their downward trend. Wednesday's EIA report showed a significantly positive crude oil inventory data, with U.S. commercial crude oil inventories falling by 8.26 million barrels in the week ending June 12, far exceeding market expectations of a 4.6 million barrel drop—nearly double the anticipated decline.
This marks the tenth consecutive week of decline in U.S. crude oil inventories, with the continued destocking trend bringing inventory levels to their lowest level in over forty years, fully reflecting the current tight supply and demand situation in the U.S. domestic crude oil spot market.
According to traditional trading logic, unexpected inventory reduction should provide strong support for oil prices, but this time the market reaction was extremely muted, and the positive factors completely failed.
The core reason lies in the expectation of medium- to long-term supply recovery brought about by the US-Iran agreement, which has completely dominated market pricing, and the short-term benefit of tight inventory has been completely offset.
The focus of trading has shifted from the current shortage of spot goods to the reshaping of global supply following the opening of the Strait of Hormuz and the return of Iranian crude oil. Investors anticipate that crude oil supply will remain ample, thus becoming desensitized to short-term inventory data. Bullish funds are unwilling to enter the market to take over, ultimately resulting in a divergent market trend of "positive data, sharp price drop".
Institutional Views
Following the signing of the US-Iran memorandum of understanding, Goldman Sachs lowered its crude oil price forecast twice within a week. The core reason is that the recovery of navigation in the Strait of Hormuz is progressing much faster than previously predicted, bringing forward the timeline for the restoration of Persian Gulf crude oil exports to pre-war levels from the end of August to the end of July.
Goldman Sachs lowered its average WTI crude oil price forecast for Q4 2026 to $75 and its full-year 2027 average to $70, while simultaneously lowering its Q4 Brent target to $80. Following sanctions waivers, Iranian crude oil exports are expected to return rapidly, coupled with strong production increases from Gulf oil-producing countries like the UAE, and continued output from non-OPEC production in the Americas, leading to an earlier-than-expected global supply easing cycle. Although current US commercial crude oil inventories have declined for ten consecutive weeks and are at a 40-year low, short-term inventory tightness has been completely offset by medium- to long-term supply recovery expectations, shifting market focus to a longer-term surplus.
Goldman Sachs also warned of two-way risks in the market. If the Iran nuclear negotiations break down and the Strait of Hormuz is blocked again, oil prices could rise to above $110. If the agreement is implemented smoothly and the geopolitical premium continues to clear in the third quarter, the probability of oil prices falling to the $70 range will increase significantly. In terms of trading strategy, it is recommended not to chase the short position in the short term, but to build short positions in batches on rebounds to protect the position.
JPMorgan Chase holds a bearish view on the short-term trend of crude oil, believing that WTI could potentially test the $70 mark within weeks. The firm stated that the peace agreement between the US and Iran completely dispelled months of market panic regarding the Middle East supply crisis, and the massive geopolitical risk premium previously priced into oil prices was released in a concentrated manner, which was the core driver of this round of oil price plunges.
JPMorgan Chase estimates that over 160 million barrels of crude oil are currently stranded in the Gulf region awaiting shipment. Once shipping through the strait resumes, these barrels will continue to flow into the global market, gradually reshaping the loose supply-demand balance. Although US domestic inventories continue to decline and the summer travel season supports physical demand, the increase in supply is sufficient to cover seasonal consumption increases, making it difficult to create a sustained bullish effect.
In the medium to long term, JPMorgan Chase predicts a significant oversupply in the global oil market by 2027, with the supply-demand gap completely reversed. Meanwhile, the hawkish signals from the new Federal Reserve chairman and rising US Treasury yields are suppressing commodity valuations, further dampening bullish sentiment in the oil market.
JPMorgan Chase cautioned that there is uncertainty regarding the implementation of the agreement. If disagreements arise at the Swiss talks on Friday, a short-term rebound could occur. It is recommended to sell short on rallies within the $76-$78 resistance range, and for long-term positions, wait for the price to fall below $70 before establishing long positions.
Technical Analysis
According to the daily chart, the overall downtrend in US crude oil futures is clear, with prices breaking sharply below all short- and medium-term moving averages. The 20-day moving average (MA20) (88.00), 50-day moving average (MA50) (93.86), and 100-day moving average (MA100) (87.44) have formed strong resistance levels. The core resistance zone above is $88-94, while the initial support level is $73.68. If this level is broken, the price will likely test the previous support level of $65-66.
In terms of indicators, the MACD lines continue to run below the zero axis, the DIFF is below the DEA, and the green bars continue to expand, indicating that the bearish momentum is being released. The RSI value is 30.28, which is close to the 20 oversold threshold. There is a slight need for oversold correction in the short term, but no clear bottom divergence reversal signal has appeared.
In terms of price structure, oil prices have been trending downwards since the year's high of $119.48. Recently, the price has accelerated its decline due to supply expectations following a potential truce between the US and Iran, hitting a low of $73.42 during the session. Prices have closed lower for several consecutive days, with weak rebounds; each slight recovery has been met with resistance from short-term moving averages, leading to further declines. A short-term technical rebound is possible, supported by the 200-day moving average, but the overall downtrend is unlikely to reverse quickly, limiting the upside potential. If the $73.68 support level is breached, further downside potential will open up. The overall strategy should be to sell on rallies, with only small positions available for short-term corrections near the $70 oversold level.
At 15:53 Beijing time on June 18, US crude oil futures were trading at $74.33 per barrel.
- Risk Warning and Disclaimer
- The market involves risk, and trading may not be suitable for all investors. This article is for reference only and does not constitute personal investment advice, nor does it take into account certain users’ specific investment objectives, financial situation, or other needs. Any investment decisions made based on this information are at your own risk.