Half of the officials support another interest rate hike, yet gold prices once rose above $4,300—a discrepancy that hides a deeper meaning.
2026-06-18 16:37:44
On Thursday (June 18) during the European session, spot gold rose by about 0.6%, trading around $4,290 per ounce, after having previously climbed above $4,300.
On June 18 local time, Pakistani Prime Minister Sheikh Sharif confirmed that the United States and Iran had signed a landmark document, the "Memorandum of Understanding between the United States of America and the Islamic Republic of Iran in Islamabad," via electronic remote channel. The agreement will take effect immediately, with the core objective of ending the long-standing hostility between the two countries, reopening the Strait of Hormuz, a vital global energy route, and significantly alleviating market concerns about disruptions to energy supplies from the Middle East.
Trump also stated that the 60-day negotiation period set for the final Iran nuclear deal was not a hard deadline and could be flexibly extended if the progress of the negotiations was not as expected. This statement dispelled market panic about a breakdown in negotiations and the resurgence of geopolitical conflicts, and significantly restored global investors' risk appetite.
The Federal Reserve's hawkish stance at its policy meeting on Wednesday, with the dot plot showing that half of the officials supported another rate hike this year, completely cooled expectations of a rate cut. The safe-haven dollar surged, reaching its highest level since the end of March, continuing to suppress precious metal prices. Following the news of easing tensions between the US and Iran, geopolitical safe-haven trading quickly subsided, with long positions in the dollar and US Treasuries being liquidated, leading to a slight pullback in the dollar index.
Gold is priced in US dollars, and a weaker dollar directly increases its attractiveness as an asset allocation. A significant amount of capital has flowed away from dollar assets, with some pouring into the precious metals market to buy on dips, providing key support for a short-term rebound in gold prices. However, the expectation of high interest rates from the Federal Reserve has not dissipated, which will still limit the upside potential of this gold rebound.
As expected, the market welcomed the latest interest rate decision from the Federal Reserve. In the first policy meeting chaired by the new Chairman Warsh, the Fed maintained the benchmark interest rate unchanged at 3.50%-3.75%, in line with mainstream market expectations.
However, the core highlight of this meeting leaned towards a hawkish stance. The policy statement completely removed all dovish language, extinguished market illusions of interest rate cuts, and clearly signaled a policy inclination towards subsequent interest rate hikes, significantly reversing market liquidity expectations.
Impacted by the hawkish decision, the market quickly priced in subsequent monetary policy, with interest rate futures data showing the probability of a 25 basis point rate hike in December climbing to a high of 85%. This expectation drove US Treasury yields sharply higher overnight, continuing to provide support for the US dollar.
Against this backdrop, gold, with its interest-free nature, is under significant pressure, and bullish bets in the market have cooled considerably. Although gold recently rebounded from its year-to-date low of $4020-$4025, this rally lacks core positive support. Under the pressure of high interest rates and a strong dollar, the sustainability of the rebound is questionable. Sustained buying is needed to confirm the validity of this recovery; otherwise, it will likely return to a consolidation phase.
UBS holds a cautiously bearish view on gold prices in the short term, significantly lowering its short-term price forecast. They believe the Fed's June meeting released a clear hawkish signal, with half of the officials supporting another rate hike this year, pushing the expectation of a rate cut directly to 2027. The continued rise in US Treasury real yields significantly increases the holding cost of non-interest-bearing gold, which is the core negative factor suppressing gold prices. The slight rebound brought about by the recent easing of US-Iran geopolitical tensions is merely a sentiment recovery and lacks sustainability. Gold's sensitivity to safe-haven events has clearly decreased, and funds continue to flow out of gold ETFs.
From a technical perspective, gold prices rebounded but faced resistance at the 20-day moving average (MA20), with short-term support seen in the $4,000-$3,850 range. However, the medium- to long-term outlook remains optimistic. The structural demand for gold purchases by global central banks and the diversification of foreign exchange reserves will not change, and the year-end target price remains at $5,200. It is recommended to reduce positions on short-term rebounds and then gradually build long positions after a significant pullback.
JPMorgan Chase stated that in the short term, it acknowledges that the Fed's high interest rate environment will limit the extent of gold's rebound. The current recovery in gold prices from the low of $4023 lacks sustained incremental buying, and the 20-day moving average at $4378 presents strong resistance. Before inflation data shows a significant decline, it will be difficult for gold prices to embark on a one-sided upward trend.
However, we remain optimistic about the market outlook from the fourth quarter to the end of the year, giving a target price of $6,000 by the end of 2026. Long-term supporting factors include the continued expansion of the US fiscal deficit, weakening dollar credibility, continuous gold purchases by global central banks, and the persistent geopolitical risks, all of which highlight gold's value as a reserve and store of value. The US-Iran agreement easing energy inflation is only a short-term negative for the dollar and is unlikely to reverse the medium- to long-term upward trend. Our strategy is to avoid chasing highs and instead wait for a pullback to the $4,050-$4,100 support range for phased long-term positioning.
According to the daily chart, spot gold previously tested the year's low of $4023.85 and then underwent a slight recovery. Currently, the price is under pressure below various moving averages, with the short-term 20-day moving average (MA20) at $4378.79 and the medium-term 50-day moving average (MA50) at $4554.03 forming layers of resistance. The overall moving average alignment indicates a bearish pattern that has not reversed, and the medium-term downtrend remains intact. Key support levels below are the previous lows of $4023.85 and $4099.02, which represent the core bottom range of this round of decline.
In terms of indicators, the MACD lines continue to run below the zero axis, the DIFF line has slightly crossed the DEA line to form a weak golden cross, and the red histogram is very small. Although the bearish momentum has weakened, the bullish counterattack is extremely weak. The RSI value is 43.60, which is in the neutral to weak range and has not yet entered the oversold range, indicating that the downside risk has not been fully released.
In terms of price structure, gold prices have been trending downwards since the historical high of 5596.33. This rebound is merely a technical correction after the sharp decline, with prices encountering resistance and falling back near the 20-day moving average, showing weak upward momentum. If the price cannot hold above 4378 in the short term, the rebound is likely to fail, and prices may retest the low of 4023. Only a breakout above the 50-day moving average (MA50) at 4554 with significant volume can reverse the short-term bearish structure. Overall, the technical picture is dominated by bears, with short-term trading likely to be characterized by weak, low-level consolidation and correction, and no clear trend reversal signal yet.
(Spot gold daily chart, source: FX678)
At 16:04 Beijing time on June 18, spot gold was trading at $4290.60 per ounce.
The US-Iran peace agreement weakens the safe-haven dollar, giving gold a breather.
On June 18 local time, Pakistani Prime Minister Sheikh Sharif confirmed that the United States and Iran had signed a landmark document, the "Memorandum of Understanding between the United States of America and the Islamic Republic of Iran in Islamabad," via electronic remote channel. The agreement will take effect immediately, with the core objective of ending the long-standing hostility between the two countries, reopening the Strait of Hormuz, a vital global energy route, and significantly alleviating market concerns about disruptions to energy supplies from the Middle East.
Trump also stated that the 60-day negotiation period set for the final Iran nuclear deal was not a hard deadline and could be flexibly extended if the progress of the negotiations was not as expected. This statement dispelled market panic about a breakdown in negotiations and the resurgence of geopolitical conflicts, and significantly restored global investors' risk appetite.
The Federal Reserve's hawkish stance at its policy meeting on Wednesday, with the dot plot showing that half of the officials supported another rate hike this year, completely cooled expectations of a rate cut. The safe-haven dollar surged, reaching its highest level since the end of March, continuing to suppress precious metal prices. Following the news of easing tensions between the US and Iran, geopolitical safe-haven trading quickly subsided, with long positions in the dollar and US Treasuries being liquidated, leading to a slight pullback in the dollar index.
Gold is priced in US dollars, and a weaker dollar directly increases its attractiveness as an asset allocation. A significant amount of capital has flowed away from dollar assets, with some pouring into the precious metals market to buy on dips, providing key support for a short-term rebound in gold prices. However, the expectation of high interest rates from the Federal Reserve has not dissipated, which will still limit the upside potential of this gold rebound.
The Fed's hawkish stance limited the dollar's decline, putting pressure on gold, a non-interest-bearing asset.
As expected, the market welcomed the latest interest rate decision from the Federal Reserve. In the first policy meeting chaired by the new Chairman Warsh, the Fed maintained the benchmark interest rate unchanged at 3.50%-3.75%, in line with mainstream market expectations.
However, the core highlight of this meeting leaned towards a hawkish stance. The policy statement completely removed all dovish language, extinguished market illusions of interest rate cuts, and clearly signaled a policy inclination towards subsequent interest rate hikes, significantly reversing market liquidity expectations.
Impacted by the hawkish decision, the market quickly priced in subsequent monetary policy, with interest rate futures data showing the probability of a 25 basis point rate hike in December climbing to a high of 85%. This expectation drove US Treasury yields sharply higher overnight, continuing to provide support for the US dollar.
Against this backdrop, gold, with its interest-free nature, is under significant pressure, and bullish bets in the market have cooled considerably. Although gold recently rebounded from its year-to-date low of $4020-$4025, this rally lacks core positive support. Under the pressure of high interest rates and a strong dollar, the sustainability of the rebound is questionable. Sustained buying is needed to confirm the validity of this recovery; otherwise, it will likely return to a consolidation phase.
Institutional Views
UBS holds a cautiously bearish view on gold prices in the short term, significantly lowering its short-term price forecast. They believe the Fed's June meeting released a clear hawkish signal, with half of the officials supporting another rate hike this year, pushing the expectation of a rate cut directly to 2027. The continued rise in US Treasury real yields significantly increases the holding cost of non-interest-bearing gold, which is the core negative factor suppressing gold prices. The slight rebound brought about by the recent easing of US-Iran geopolitical tensions is merely a sentiment recovery and lacks sustainability. Gold's sensitivity to safe-haven events has clearly decreased, and funds continue to flow out of gold ETFs.
From a technical perspective, gold prices rebounded but faced resistance at the 20-day moving average (MA20), with short-term support seen in the $4,000-$3,850 range. However, the medium- to long-term outlook remains optimistic. The structural demand for gold purchases by global central banks and the diversification of foreign exchange reserves will not change, and the year-end target price remains at $5,200. It is recommended to reduce positions on short-term rebounds and then gradually build long positions after a significant pullback.
JPMorgan Chase stated that in the short term, it acknowledges that the Fed's high interest rate environment will limit the extent of gold's rebound. The current recovery in gold prices from the low of $4023 lacks sustained incremental buying, and the 20-day moving average at $4378 presents strong resistance. Before inflation data shows a significant decline, it will be difficult for gold prices to embark on a one-sided upward trend.
However, we remain optimistic about the market outlook from the fourth quarter to the end of the year, giving a target price of $6,000 by the end of 2026. Long-term supporting factors include the continued expansion of the US fiscal deficit, weakening dollar credibility, continuous gold purchases by global central banks, and the persistent geopolitical risks, all of which highlight gold's value as a reserve and store of value. The US-Iran agreement easing energy inflation is only a short-term negative for the dollar and is unlikely to reverse the medium- to long-term upward trend. Our strategy is to avoid chasing highs and instead wait for a pullback to the $4,050-$4,100 support range for phased long-term positioning.
Technical Analysis
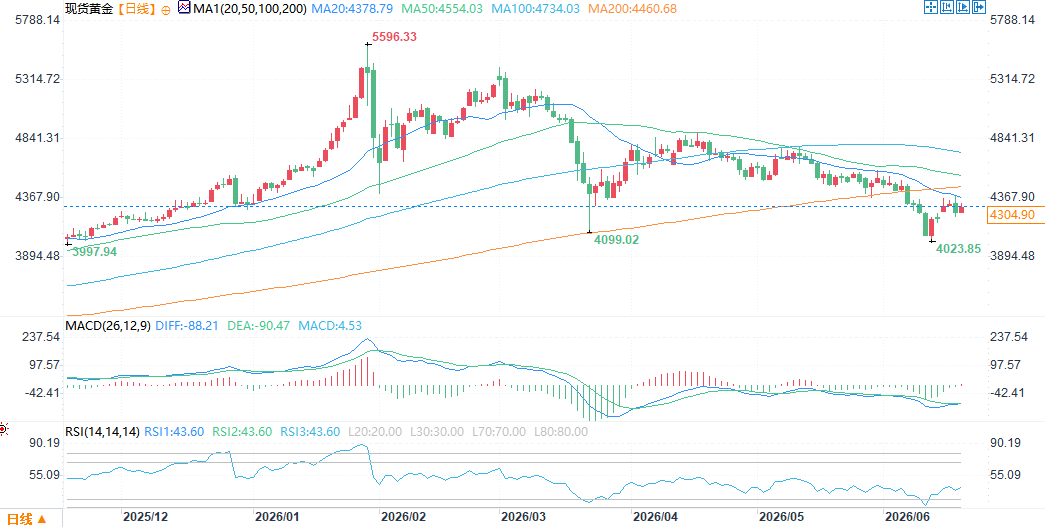
According to the daily chart, spot gold previously tested the year's low of $4023.85 and then underwent a slight recovery. Currently, the price is under pressure below various moving averages, with the short-term 20-day moving average (MA20) at $4378.79 and the medium-term 50-day moving average (MA50) at $4554.03 forming layers of resistance. The overall moving average alignment indicates a bearish pattern that has not reversed, and the medium-term downtrend remains intact. Key support levels below are the previous lows of $4023.85 and $4099.02, which represent the core bottom range of this round of decline.
In terms of indicators, the MACD lines continue to run below the zero axis, the DIFF line has slightly crossed the DEA line to form a weak golden cross, and the red histogram is very small. Although the bearish momentum has weakened, the bullish counterattack is extremely weak. The RSI value is 43.60, which is in the neutral to weak range and has not yet entered the oversold range, indicating that the downside risk has not been fully released.
In terms of price structure, gold prices have been trending downwards since the historical high of 5596.33. This rebound is merely a technical correction after the sharp decline, with prices encountering resistance and falling back near the 20-day moving average, showing weak upward momentum. If the price cannot hold above 4378 in the short term, the rebound is likely to fail, and prices may retest the low of 4023. Only a breakout above the 50-day moving average (MA50) at 4554 with significant volume can reverse the short-term bearish structure. Overall, the technical picture is dominated by bears, with short-term trading likely to be characterized by weak, low-level consolidation and correction, and no clear trend reversal signal yet.
(Spot gold daily chart, source: FX678)
At 16:04 Beijing time on June 18, spot gold was trading at $4290.60 per ounce.
- Risk Warning and Disclaimer
- The market involves risk, and trading may not be suitable for all investors. This article is for reference only and does not constitute personal investment advice, nor does it take into account certain users’ specific investment objectives, financial situation, or other needs. Any investment decisions made based on this information are at your own risk.