Gold Trading Alert: Gold Prices Encounter a "Perfect Storm," Three Consecutive Weeks of Decline, the $4,000 Mark Faces a Test
2026-06-22 07:14:37
The gold market in June is undergoing its most severe test since the start of the bull market in 2022. As of the week ending June 19, spot gold closed at $4155.44 per ounce, a weekly decline of approximately 1.46%, marking its third consecutive week of losses. Since reaching a historical high of approximately $5600 per ounce on January 29, gold prices have retreated by more than 26%. Behind this decline is the combined effect of three forces: a shift in Federal Reserve policy, geopolitical tensions, and negative feedback from the money market. On Monday (June 22) in early Asian trading, spot gold traded in a narrow range, currently hovering around $4160 per ounce.

The interest rate meeting held on June 17-18 was the new chairman's debut. This meeting completely rewrote market expectations for the path of monetary policy.
At the policy level, the target range for interest rates remained unchanged at 3.50% to 3.75%, but what truly shook the market was not the interest rates themselves, but the systemic changes brought about by the new chairman. The policy statement was drastically reduced to only 130 words, setting a record for the shortest in many years; traditional forward guidance was completely eliminated; and the new chairman himself refused to submit dot plot interest rate forecasts, becoming the first Fed chairman not to participate in the reporting of interest rate levels.
What surprised the market even more was the hawkish signal released by the dot plot. Nearly half of the officials who submitted interest rate forecasts expect rates to be higher than the current range by the end of the year, with at least one rate hike expected throughout the year. The median interest rate forecast has shifted significantly upward compared to previous forecasts. Just three months ago, the market was still discussing the timing of rate cuts.
The new president mentioned inflation 12 times and employment only 5 times at the press conference, repeatedly emphasizing that "the 2% inflation target is a core mission that remains unchanged in the long term." This contrasts sharply with the previous president's more tolerant attitude of "flexible average inflation targeting." The market reacted swiftly, with interest rate futures showing a greater than 50% probability of a September rate hike and a near 100% probability of a rate hike this year. The US dollar index subsequently climbed to a 13-month high, and the 10-year US Treasury yield rose to the 4.45% to 4.60% range. For gold, a non-interest-bearing asset, the significant increase in the opportunity cost of holding it is the most direct blow.
Traditional logic dictates that escalating geopolitical conflicts drive safe-haven buying of gold. However, the current developments in the Middle East present a completely different transmission chain.
Recently, the US and Iran signed a memorandum of understanding, with the US agreeing to grant Iran waivers for oil exports and Iran promising to gradually open the Strait of Hormuz. This should have been a sign of geopolitical easing, but subsequent developments have been dramatic. The Iranian armed forces announced the closure of the Strait of Hormuz, citing "the US's failure to fulfill its commitments and Israel's continued violations of the ceasefire agreement." The US immediately issued a stern warning, stating that it would take strong measures if the agreement failed to be reached; in media interviews, the US even went so far as to say, "If the Iranians block the Strait of Hormuz, they will lose a country."
The subsequent direct negotiations in Switzerland lasted only about 80 minutes before encountering a setback. The Iranian delegation suspended the talks and left the venue, citing protests against threatening remarks from the United States. Iran's chief representative responded on social media: "They had better watch their words; our armed forces are ready to respond to them in different ways."
The anomaly lies in the fundamental shift in the transmission chain. Analysis indicates that geopolitical conflicts initially drive up oil prices, which in turn exacerbate inflation stickiness. This increased inflation stickiness strengthens expectations of interest rate hikes, which in turn push up real interest rates, ultimately suppressing gold prices. This chain completely overrides the traditional logic of safe-haven buying. In other words, the more tense the Middle East becomes, the higher oil prices rise, the more stubborn inflation becomes, the more the Federal Reserve needs to raise interest rates, and the more gold prices fall – this is precisely the most fatal "abnormality" in the current market.
From a technical perspective, gold's situation is equally unfavorable. Since the beginning of June, gold prices have been hovering below the 200-day moving average. This technical level, which many traders consider a dividing line between bull and bear markets, has already been effectively broken.
Gold prices are currently about $200 below the 200-day moving average, making many trend traders reluctant to re-establish long positions. Technical analysis shows that gold is exhibiting a downtrend structure of "lower highs and lower lows," with momentum indicators still bearish and not yet in oversold territory, suggesting that the decline may not yet be over.
Regarding key support levels, recent intraday lows are considered a short-term "ironclad bottom"; a break below this level would open up further downside potential. The $4,000 level is widely recognized as the final psychological barrier and a key area for central bank gold purchases. Several institutions have significantly lowered their short-term gold price targets to around $4,000, explicitly stating that this price level is the next crucial support.
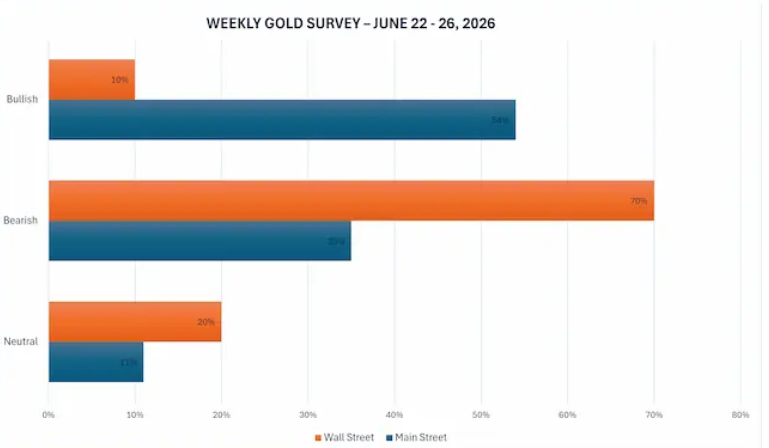
Faced with the continued adjustment in gold prices, professional institutions and retail investors have shown a clear divergence in their positions.
Recent surveys show that only 10% of Wall Street analysts expect gold prices to rise next week, 70% are bearish, and 20% believe they will consolidate sideways. Some warn that the current gold rally from around $4,000 is "increasingly more like a technical bounce than a trend reversal," with the market more inclined to view the rally as a selling opportunity. Other analysts predict that gold needs to fall below $4,000 to confirm their bearish view.
In stark contrast, more than half of retail investors remain bullish on gold prices next week. This widening divergence between bulls and bears reflects that the market is at a critical juncture in choosing its direction. Meanwhile, some institutions have lowered their year-end gold price forecasts from $5,400 to $4,900, stating that they are "structurally bullish on gold, but tactically cautious, facing short-term downside risks while having upside potential in the medium term."
Despite short-term pressure, the long-term support logic for gold has not collapsed. Continued gold purchases by global central banks remain the most stable support on the demand side.
A recent survey shows that nearly 90% of central bank reserve managers expect global central bank gold reserves to continue to increase in the next 12 months; more than 40% of the surveyed central banks indicated they expect to increase their gold reserves in the next 12 months, a record high. Meanwhile, over 90% of the surveyed central banks reported holding gold, a significant increase compared to previous years.
Meanwhile, market concerns about the credibility of the US dollar continue to deepen. Most central banks surveyed expect the dollar's share of global reserves to decline over the next five years. With US national debt exceeding $39 trillion, while high interest rates may strengthen the dollar's credibility in the short term, the cost of continuously rising fiscal interest payment pressure cannot be ignored. Gold, as a reserve asset without sovereign credit, continues to rise in strategic importance.
The current gold market is experiencing a fierce clash between short-term and long-term logics. The Fed's policy shift leading to interest rate resets, the distorted geopolitical transmission chain, and technical breakdown pressures have combined to create a short-term "perfect storm." The $4,000 level is both the last line of defense technically and a psychological watershed for both bulls and bears.
In the coming week, the final reading of US GDP, inflation data, and preliminary PMI figures for manufacturing and services will be released. Meanwhile, the trajectory of Middle East negotiations and a flurry of speeches by Federal Reserve officials will continue to disrupt the market. For gold investors, instead of panicking and chasing highs and lows, it's better to calmly examine whether the long-term value logic of gold, as the ultimate asset against the risks of the US dollar's credit system, has truly changed as short-term market noise gradually dissipates. The answer may lie in the battle between bulls and bears around the $4,000 mark.
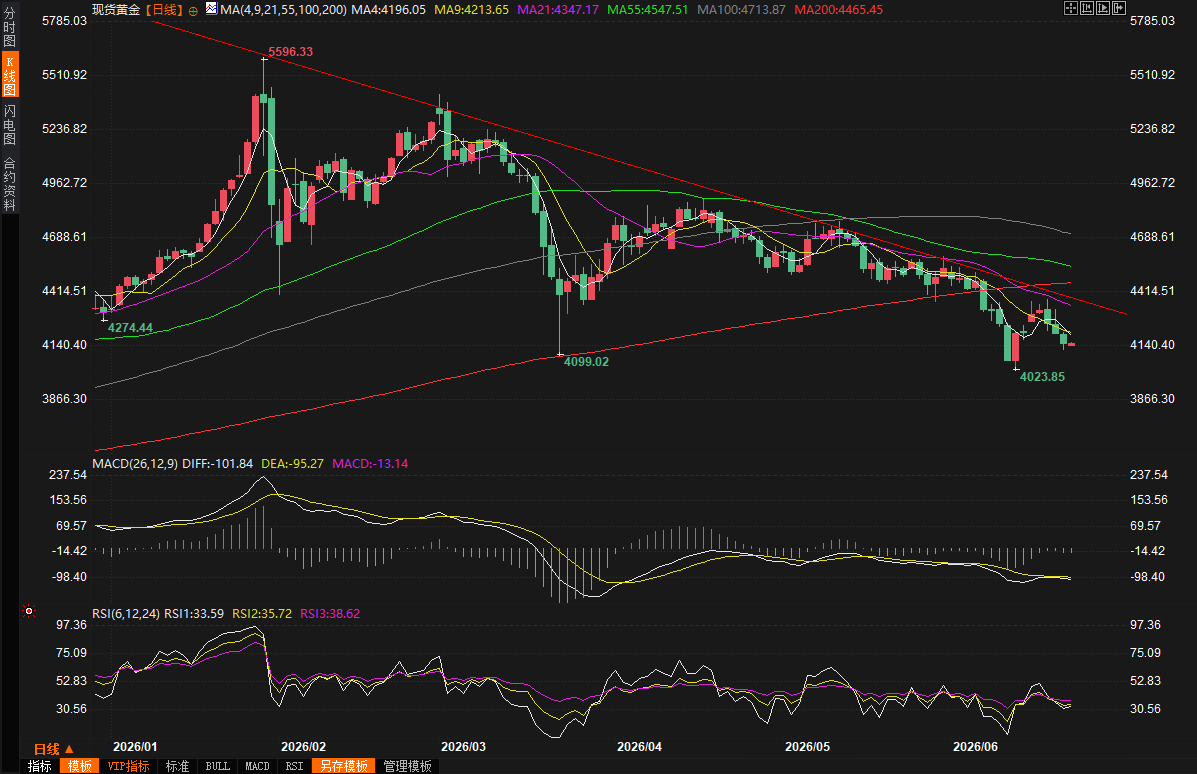
(Spot gold daily chart, source: FX678)
At 07:12 Beijing time, spot gold was trading at $4180.61 per ounce.
I. Policy Debut: A "Hawkish Revolution" That Shook the Market
The interest rate meeting held on June 17-18 was the new chairman's debut. This meeting completely rewrote market expectations for the path of monetary policy.
At the policy level, the target range for interest rates remained unchanged at 3.50% to 3.75%, but what truly shook the market was not the interest rates themselves, but the systemic changes brought about by the new chairman. The policy statement was drastically reduced to only 130 words, setting a record for the shortest in many years; traditional forward guidance was completely eliminated; and the new chairman himself refused to submit dot plot interest rate forecasts, becoming the first Fed chairman not to participate in the reporting of interest rate levels.
What surprised the market even more was the hawkish signal released by the dot plot. Nearly half of the officials who submitted interest rate forecasts expect rates to be higher than the current range by the end of the year, with at least one rate hike expected throughout the year. The median interest rate forecast has shifted significantly upward compared to previous forecasts. Just three months ago, the market was still discussing the timing of rate cuts.
The new president mentioned inflation 12 times and employment only 5 times at the press conference, repeatedly emphasizing that "the 2% inflation target is a core mission that remains unchanged in the long term." This contrasts sharply with the previous president's more tolerant attitude of "flexible average inflation targeting." The market reacted swiftly, with interest rate futures showing a greater than 50% probability of a September rate hike and a near 100% probability of a rate hike this year. The US dollar index subsequently climbed to a 13-month high, and the 10-year US Treasury yield rose to the 4.45% to 4.60% range. For gold, a non-interest-bearing asset, the significant increase in the opportunity cost of holding it is the most direct blow.
II. The “Alienation” of Geopolitics: Why Does the Logic of Risk Aversion Fail?
Traditional logic dictates that escalating geopolitical conflicts drive safe-haven buying of gold. However, the current developments in the Middle East present a completely different transmission chain.
Recently, the US and Iran signed a memorandum of understanding, with the US agreeing to grant Iran waivers for oil exports and Iran promising to gradually open the Strait of Hormuz. This should have been a sign of geopolitical easing, but subsequent developments have been dramatic. The Iranian armed forces announced the closure of the Strait of Hormuz, citing "the US's failure to fulfill its commitments and Israel's continued violations of the ceasefire agreement." The US immediately issued a stern warning, stating that it would take strong measures if the agreement failed to be reached; in media interviews, the US even went so far as to say, "If the Iranians block the Strait of Hormuz, they will lose a country."
The subsequent direct negotiations in Switzerland lasted only about 80 minutes before encountering a setback. The Iranian delegation suspended the talks and left the venue, citing protests against threatening remarks from the United States. Iran's chief representative responded on social media: "They had better watch their words; our armed forces are ready to respond to them in different ways."
The anomaly lies in the fundamental shift in the transmission chain. Analysis indicates that geopolitical conflicts initially drive up oil prices, which in turn exacerbate inflation stickiness. This increased inflation stickiness strengthens expectations of interest rate hikes, which in turn push up real interest rates, ultimately suppressing gold prices. This chain completely overrides the traditional logic of safe-haven buying. In other words, the more tense the Middle East becomes, the higher oil prices rise, the more stubborn inflation becomes, the more the Federal Reserve needs to raise interest rates, and the more gold prices fall – this is precisely the most fatal "abnormality" in the current market.
III. Technical Crisis: $4,000 Becomes the Last Line of Defense
From a technical perspective, gold's situation is equally unfavorable. Since the beginning of June, gold prices have been hovering below the 200-day moving average. This technical level, which many traders consider a dividing line between bull and bear markets, has already been effectively broken.
Gold prices are currently about $200 below the 200-day moving average, making many trend traders reluctant to re-establish long positions. Technical analysis shows that gold is exhibiting a downtrend structure of "lower highs and lower lows," with momentum indicators still bearish and not yet in oversold territory, suggesting that the decline may not yet be over.
Regarding key support levels, recent intraday lows are considered a short-term "ironclad bottom"; a break below this level would open up further downside potential. The $4,000 level is widely recognized as the final psychological barrier and a key area for central bank gold purchases. Several institutions have significantly lowered their short-term gold price targets to around $4,000, explicitly stating that this price level is the next crucial support.
IV. Market Divergence: Professional Bears vs. Retail Investors Holding Firm
Faced with the continued adjustment in gold prices, professional institutions and retail investors have shown a clear divergence in their positions.
Recent surveys show that only 10% of Wall Street analysts expect gold prices to rise next week, 70% are bearish, and 20% believe they will consolidate sideways. Some warn that the current gold rally from around $4,000 is "increasingly more like a technical bounce than a trend reversal," with the market more inclined to view the rally as a selling opportunity. Other analysts predict that gold needs to fall below $4,000 to confirm their bearish view.
In stark contrast, more than half of retail investors remain bullish on gold prices next week. This widening divergence between bulls and bears reflects that the market is at a critical juncture in choosing its direction. Meanwhile, some institutions have lowered their year-end gold price forecasts from $5,400 to $4,900, stating that they are "structurally bullish on gold, but tactically cautious, facing short-term downside risks while having upside potential in the medium term."
V. Central Bank Gold Purchases: The "Ballast" of Long-Term Logic
Despite short-term pressure, the long-term support logic for gold has not collapsed. Continued gold purchases by global central banks remain the most stable support on the demand side.
A recent survey shows that nearly 90% of central bank reserve managers expect global central bank gold reserves to continue to increase in the next 12 months; more than 40% of the surveyed central banks indicated they expect to increase their gold reserves in the next 12 months, a record high. Meanwhile, over 90% of the surveyed central banks reported holding gold, a significant increase compared to previous years.
Meanwhile, market concerns about the credibility of the US dollar continue to deepen. Most central banks surveyed expect the dollar's share of global reserves to decline over the next five years. With US national debt exceeding $39 trillion, while high interest rates may strengthen the dollar's credibility in the short term, the cost of continuously rising fiscal interest payment pressure cannot be ignored. Gold, as a reserve asset without sovereign credit, continues to rise in strategic importance.
VI. Market Outlook
The current gold market is experiencing a fierce clash between short-term and long-term logics. The Fed's policy shift leading to interest rate resets, the distorted geopolitical transmission chain, and technical breakdown pressures have combined to create a short-term "perfect storm." The $4,000 level is both the last line of defense technically and a psychological watershed for both bulls and bears.
In the coming week, the final reading of US GDP, inflation data, and preliminary PMI figures for manufacturing and services will be released. Meanwhile, the trajectory of Middle East negotiations and a flurry of speeches by Federal Reserve officials will continue to disrupt the market. For gold investors, instead of panicking and chasing highs and lows, it's better to calmly examine whether the long-term value logic of gold, as the ultimate asset against the risks of the US dollar's credit system, has truly changed as short-term market noise gradually dissipates. The answer may lie in the battle between bulls and bears around the $4,000 mark.
(Spot gold daily chart, source: FX678)
At 07:12 Beijing time, spot gold was trading at $4180.61 per ounce.
- Risk Warning and Disclaimer
- The market involves risk, and trading may not be suitable for all investors. This article is for reference only and does not constitute personal investment advice, nor does it take into account certain users’ specific investment objectives, financial situation, or other needs. Any investment decisions made based on this information are at your own risk.