After the 70 billion yen intervention went down the drain, yen bears are targeting a 40-year low, but what did the MACD betray?
2026-06-23 20:13:11
On Tuesday (June 23), the USD/JPY pair paused briefly after hitting a two-year low of 161.92 on Monday, trading around 161.60. Former Bank of Japan policy board member Sayuri Shirai publicly warned that if the Federal Reserve begins raising interest rates this year, the exchange rate could gradually move towards the 163-165 range. This statement quickly ignited market concerns about further yen depreciation. Shirai pointed out that the Ministry of Finance and the Bank of Japan had "allowed" the exchange rate to break through 160 since early June, making a reversal of the current trend extremely difficult. This statement resonated with market movements: the 240-minute candlestick chart showed that although the price remained above the Bollinger Band's middle line, a MACD death cross was emerging at a high level, suggesting that short-term upward momentum was weakening, and the market was stuck at a key resistance level.
The core reason for the current weakness of the yen lies in the persistently high interest rate differential between the US and Japan. Although the Bank of Japan raised its policy rate by 25 basis points to 1% last week, the highest since 1995, the gap with the Federal Reserve's interest rate range of 3.50%-3.75% remains above 250 basis points. More importantly, the Federal Reserve, under its new chairman Kevin Warsh, has maintained a hawkish stance and held rates steady, leading to a repricing of market expectations for a rate hike this year . Traders are betting on a 75% probability of a rate hike before September, and several prominent institutions, including Bank of America and Deutsche Bank, have abandoned their previous assessment of no change in policy and are now predicting that the Fed will resume rate hikes this year. Shirai stated that if the US action materializes, the USD/JPY exchange rate could gradually move towards 163-165, which would push the yen to its weakest level since 1986.
The Bank of Japan's room for further interest rate hikes is also limited. Shirai predicts the BOJ may raise rates by another 25 basis points in October or December, with the mainstream market expectation being that the final interest rate target next year is only 1.5%—"which may be the limit the central bank can achieve." Jesper Koll, Global Ambassador at Monex Group, offers a more optimistic view, estimating Japan's neutral interest rate at around 3% based on the Taylor rule, and arguing that the continued depreciation of the yen clearly reveals that investors' assessment of the central bank is outdated. However, the market seems to disagree with this optimistic projection. The latest data from the U.S. Commodity Futures Trading Commission shows that speculative net short positions in the yen have risen to 150,132 contracts, a new high since July 2024, with both retail and institutional investors showing increased short-selling intentions.
The weakening credibility of intervention is another source of pressure. Tokyo used a total of 11.7 trillion yen (approximately US$72.44 billion) for foreign exchange intervention from late April to early May, but the effects were short-lived. Shirai bluntly stated that it is difficult to predict whether the Ministry of Finance will intervene again at this stage, because US Treasury Secretary Bessenter has sent a clear signal: Japan needs to curb the yen's depreciation through interest rate hikes, rather than relying on intervention by selling US Treasury bonds. This essentially links the yen's exchange rate issue to the stability of the US Treasury market, significantly narrowing the window for unilateral Japanese action.
Domestic fiscal uncertainty in Japan has exacerbated selling pressure on assets. Prime Minister Sanae Takaichi plans to temporarily lower the food consumption tax from 8% to 1%, but has not specified alternative funding sources. Investor concerns about lax fiscal discipline have pushed up Japanese government bond yields, with the 10-year JGB yield rising to 2.66%. Shirai points out that the market even expects yields to rise above 3%, which would significantly increase the Ministry of Finance's interest burden. Tuesday's 5-year bond auction saw weak demand, with a bid-to-cover ratio of only 3.11, below the average of 3.31 for the previous six auctions, and a tail spread of 1.4 basis points, contributing to a flattening of the yield curve. These supply and demand signals indicate that market concerns about Japan's policy credibility are transmitting from the exchange rate to the bond market, creating a negative feedback loop.
Mapping the aforementioned macroeconomic pressures onto the 4-hour chart, the USD/JPY pair is currently in a short-term correction phase within a medium-term uptrend. The price is positioned between the upper Bollinger Band (20,2) at 161.94 and the middle band at 161.40, a relatively strong area. However, it retreated from near the upper band on Tuesday, confirming selling pressure at that level. Simultaneously, the MACD indicator is issuing a warning signal: the DIFF line at 0.259 crossed below the DEA line at 0.285, forming a death cross at a high level . The green histogram value of -0.051 indicates that while bearish momentum is not yet strong, downward pressure is beginning to emerge. This pattern coincides with the price hovering around 161.92, suggesting that the bulls need to regroup.
In terms of specific ranges, the upper resistance is focused on the 161.92-162.00 area , which is the overlapping resistance formed by the two-year high reached on Monday and the upper Bollinger Band. If the expectation of a Fed rate hike intensifies further, a successful breakout of this area will naturally extend the market focus to the psychological window of 163-165 mentioned by Shirai. The lower support levels are clear: the primary focus is on the middle Bollinger Band at 161.40 , which is a short-term watershed between bulls and bears; if this level is breached, the lower Bollinger Band at 160.86 and the neckline of the previous double bottom structure at 159.54 will form subsequent buffer zones. During the trading session, close attention should be paid to changes in the implied probability of a rate hike in the Federal Funds futures during the US session, as well as the discussion on the pace of rate hikes by committee members in the summary of tomorrow's Bank of Japan policy meeting—any hint of accelerated rate hikes could trigger short covering, pushing prices towards the middle or even lower Bollinger Band.
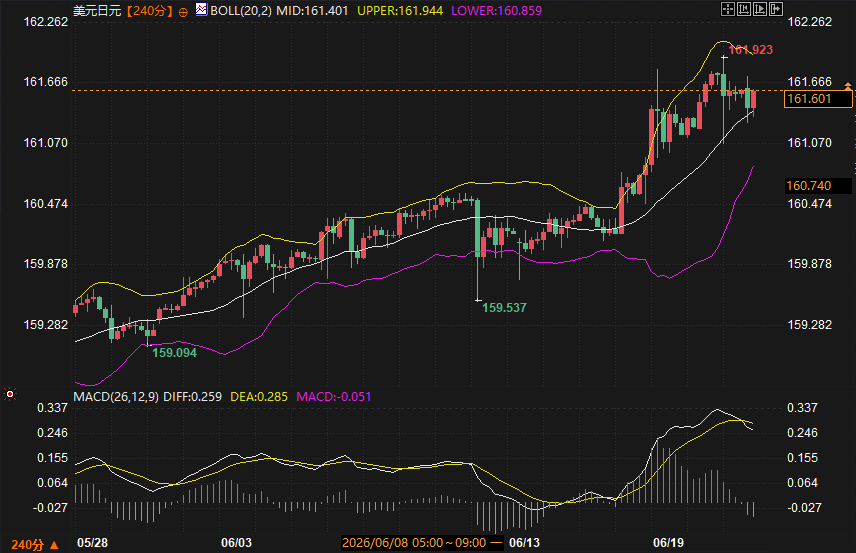
In the coming trading days, USD/JPY is likely to choose its short-term direction within the 161.40-162.00 range. A death cross signal on the technical chart usually indicates consolidation at higher levels or a mild pullback. As long as the price doesn't effectively break below the middle Bollinger Band, the medium-term bullish structure can be maintained. However, if Fed officials' speeches reinforce expectations of a rate hike this year, coupled with a break above 162.00, the market may begin a phase of upward movement towards 163. Conversely, if the Bank of Japan's meeting summary reveals more urgent discussions on rate hikes, or if fiscal concerns trigger a sharp rise in Japanese government bond yields, the yen may have a brief window for self-rescue, driving the exchange rate down to around 160.86. Traders should monitor the Bollinger Bands' opening; if the bands widen again after a period of contraction, it usually indicates that the next round of one-sided volatility is brewing.
Q: Why did a former Bank of Japan official believe that the yen could fall to 165?
A: Shirai pointed out that the interest rate differential between the US and Japan is extremely wide. If the Federal Reserve raises interest rates this year, this gap will widen further. Even if the Bank of Japan raises interest rates again, the upper limit of the terminal interest rate is quite limited. At the same time, the Ministry of Finance and the Bank of Japan have tolerated the exchange rate breaking through 160, increasing the restrictions on intervention. The combination of these factors makes 165 a conceivable technical target.
Q: The Bank of Japan has raised interest rates to 1%, so why is the yen still weak?
A: The market is pricing in the expected path of interest rate spreads, not absolute interest rate levels. With the Federal Reserve funds rate remaining at 3.50%-3.75% and rate hikes expected, the Bank of Japan's 1% rate cut cannot substantially narrow the interest rate spread. Furthermore, speculative short positions have reached new highs, indicating a lack of investor confidence in the Bank of Japan's tightening pace; this expectation gap continues to weigh on the yen.
Q: Where are the key support and resistance levels right now?
A: According to the 4-hour chart, the upper resistance is located at 161.92-162.00, which is the convergence point of the two-year high and the upper Bollinger Band. The lower support levels to watch are first 161.40 (the middle Bollinger Band), then 160.86 (the lower Bollinger Band), and finally the previous double bottom support near 159.54. These levels can be used as reference points for intraday sentiment changes.
Q: What impact does the rise in Japanese government bond yields have on the yen?
A: Theoretically, rising yields should support the yen, but the current situation is complex. The rise in Japanese bond yields is mainly driven by concerns about fiscal discipline rather than growth expectations, which in turn increases market anxiety about the sustainability of Japan's fiscal policy and inhibits capital inflows. If yields rise too rapidly, it could force the central bank to increase bond purchases, weakening the monetary tightening signal and creating reverse pressure on the yen.
Q: Does the appearance of a MACD death cross signal mean the end of an upward trend?
A: Not necessarily. A death cross at a high level signals weakening momentum, suggesting that prices are entering a pullback or consolidation phase, but a trend reversal requires prices to break below key support levels. The current 161.40 mid-line is a watershed. If it can hold and then rise again with increased volume, the upward trend will continue; if it breaks below, the pullback may deepen, but the medium-term direction still needs to be judged based on subsequent fundamental changes.
Interest rate differentials and policy dilemmas: How fundamentals are weighing on the yen's annual growth rate.
The core reason for the current weakness of the yen lies in the persistently high interest rate differential between the US and Japan. Although the Bank of Japan raised its policy rate by 25 basis points to 1% last week, the highest since 1995, the gap with the Federal Reserve's interest rate range of 3.50%-3.75% remains above 250 basis points. More importantly, the Federal Reserve, under its new chairman Kevin Warsh, has maintained a hawkish stance and held rates steady, leading to a repricing of market expectations for a rate hike this year . Traders are betting on a 75% probability of a rate hike before September, and several prominent institutions, including Bank of America and Deutsche Bank, have abandoned their previous assessment of no change in policy and are now predicting that the Fed will resume rate hikes this year. Shirai stated that if the US action materializes, the USD/JPY exchange rate could gradually move towards 163-165, which would push the yen to its weakest level since 1986.
The Bank of Japan's room for further interest rate hikes is also limited. Shirai predicts the BOJ may raise rates by another 25 basis points in October or December, with the mainstream market expectation being that the final interest rate target next year is only 1.5%—"which may be the limit the central bank can achieve." Jesper Koll, Global Ambassador at Monex Group, offers a more optimistic view, estimating Japan's neutral interest rate at around 3% based on the Taylor rule, and arguing that the continued depreciation of the yen clearly reveals that investors' assessment of the central bank is outdated. However, the market seems to disagree with this optimistic projection. The latest data from the U.S. Commodity Futures Trading Commission shows that speculative net short positions in the yen have risen to 150,132 contracts, a new high since July 2024, with both retail and institutional investors showing increased short-selling intentions.
The weakening credibility of intervention is another source of pressure. Tokyo used a total of 11.7 trillion yen (approximately US$72.44 billion) for foreign exchange intervention from late April to early May, but the effects were short-lived. Shirai bluntly stated that it is difficult to predict whether the Ministry of Finance will intervene again at this stage, because US Treasury Secretary Bessenter has sent a clear signal: Japan needs to curb the yen's depreciation through interest rate hikes, rather than relying on intervention by selling US Treasury bonds. This essentially links the yen's exchange rate issue to the stability of the US Treasury market, significantly narrowing the window for unilateral Japanese action.
Domestic fiscal uncertainty in Japan has exacerbated selling pressure on assets. Prime Minister Sanae Takaichi plans to temporarily lower the food consumption tax from 8% to 1%, but has not specified alternative funding sources. Investor concerns about lax fiscal discipline have pushed up Japanese government bond yields, with the 10-year JGB yield rising to 2.66%. Shirai points out that the market even expects yields to rise above 3%, which would significantly increase the Ministry of Finance's interest burden. Tuesday's 5-year bond auction saw weak demand, with a bid-to-cover ratio of only 3.11, below the average of 3.31 for the previous six auctions, and a tail spread of 1.4 basis points, contributing to a flattening of the yield curve. These supply and demand signals indicate that market concerns about Japan's policy credibility are transmitting from the exchange rate to the bond market, creating a negative feedback loop.
Technical Analysis: The Intersection of Resistance Confirmation and Momentum Decline
Mapping the aforementioned macroeconomic pressures onto the 4-hour chart, the USD/JPY pair is currently in a short-term correction phase within a medium-term uptrend. The price is positioned between the upper Bollinger Band (20,2) at 161.94 and the middle band at 161.40, a relatively strong area. However, it retreated from near the upper band on Tuesday, confirming selling pressure at that level. Simultaneously, the MACD indicator is issuing a warning signal: the DIFF line at 0.259 crossed below the DEA line at 0.285, forming a death cross at a high level . The green histogram value of -0.051 indicates that while bearish momentum is not yet strong, downward pressure is beginning to emerge. This pattern coincides with the price hovering around 161.92, suggesting that the bulls need to regroup.
In terms of specific ranges, the upper resistance is focused on the 161.92-162.00 area , which is the overlapping resistance formed by the two-year high reached on Monday and the upper Bollinger Band. If the expectation of a Fed rate hike intensifies further, a successful breakout of this area will naturally extend the market focus to the psychological window of 163-165 mentioned by Shirai. The lower support levels are clear: the primary focus is on the middle Bollinger Band at 161.40 , which is a short-term watershed between bulls and bears; if this level is breached, the lower Bollinger Band at 160.86 and the neckline of the previous double bottom structure at 159.54 will form subsequent buffer zones. During the trading session, close attention should be paid to changes in the implied probability of a rate hike in the Federal Funds futures during the US session, as well as the discussion on the pace of rate hikes by committee members in the summary of tomorrow's Bank of Japan policy meeting—any hint of accelerated rate hikes could trigger short covering, pushing prices towards the middle or even lower Bollinger Band.
Future Trend Outlook
In the coming trading days, USD/JPY is likely to choose its short-term direction within the 161.40-162.00 range. A death cross signal on the technical chart usually indicates consolidation at higher levels or a mild pullback. As long as the price doesn't effectively break below the middle Bollinger Band, the medium-term bullish structure can be maintained. However, if Fed officials' speeches reinforce expectations of a rate hike this year, coupled with a break above 162.00, the market may begin a phase of upward movement towards 163. Conversely, if the Bank of Japan's meeting summary reveals more urgent discussions on rate hikes, or if fiscal concerns trigger a sharp rise in Japanese government bond yields, the yen may have a brief window for self-rescue, driving the exchange rate down to around 160.86. Traders should monitor the Bollinger Bands' opening; if the bands widen again after a period of contraction, it usually indicates that the next round of one-sided volatility is brewing.
Frequently Asked Questions
Q: Why did a former Bank of Japan official believe that the yen could fall to 165?
A: Shirai pointed out that the interest rate differential between the US and Japan is extremely wide. If the Federal Reserve raises interest rates this year, this gap will widen further. Even if the Bank of Japan raises interest rates again, the upper limit of the terminal interest rate is quite limited. At the same time, the Ministry of Finance and the Bank of Japan have tolerated the exchange rate breaking through 160, increasing the restrictions on intervention. The combination of these factors makes 165 a conceivable technical target.
Q: The Bank of Japan has raised interest rates to 1%, so why is the yen still weak?
A: The market is pricing in the expected path of interest rate spreads, not absolute interest rate levels. With the Federal Reserve funds rate remaining at 3.50%-3.75% and rate hikes expected, the Bank of Japan's 1% rate cut cannot substantially narrow the interest rate spread. Furthermore, speculative short positions have reached new highs, indicating a lack of investor confidence in the Bank of Japan's tightening pace; this expectation gap continues to weigh on the yen.
Q: Where are the key support and resistance levels right now?
A: According to the 4-hour chart, the upper resistance is located at 161.92-162.00, which is the convergence point of the two-year high and the upper Bollinger Band. The lower support levels to watch are first 161.40 (the middle Bollinger Band), then 160.86 (the lower Bollinger Band), and finally the previous double bottom support near 159.54. These levels can be used as reference points for intraday sentiment changes.
Q: What impact does the rise in Japanese government bond yields have on the yen?
A: Theoretically, rising yields should support the yen, but the current situation is complex. The rise in Japanese bond yields is mainly driven by concerns about fiscal discipline rather than growth expectations, which in turn increases market anxiety about the sustainability of Japan's fiscal policy and inhibits capital inflows. If yields rise too rapidly, it could force the central bank to increase bond purchases, weakening the monetary tightening signal and creating reverse pressure on the yen.
Q: Does the appearance of a MACD death cross signal mean the end of an upward trend?
A: Not necessarily. A death cross at a high level signals weakening momentum, suggesting that prices are entering a pullback or consolidation phase, but a trend reversal requires prices to break below key support levels. The current 161.40 mid-line is a watershed. If it can hold and then rise again with increased volume, the upward trend will continue; if it breaks below, the pullback may deepen, but the medium-term direction still needs to be judged based on subsequent fundamental changes.
- Risk Warning and Disclaimer
- The market involves risk, and trading may not be suitable for all investors. This article is for reference only and does not constitute personal investment advice, nor does it take into account certain users’ specific investment objectives, financial situation, or other needs. Any investment decisions made based on this information are at your own risk.