Gold Analysis: Downtrend dominates the market; how to predict subsequent price targets?
2026-06-24 02:16:54
On Tuesday (June 23), international gold prices continued to face strong selling pressure due to rising market expectations of further tightening of monetary policy by the Federal Reserve. Coupled with a continued strengthening of the US dollar index, gold prices fell to a three-month low. During Tuesday's trading, gold prices on major compliant trading platforms fell sharply, touching the support level of $4110 per ounce.

The gold market is currently facing multiple short-term negative factors, including expectations of a Federal Reserve rate hike, a strong appreciation of the US dollar, and weak inflows of investment funds into the market. Several authoritative institutions have updated their market forecasts; Deutsche Bank and Bank of America Global Research have both revised their outlook reports, confirming that the Federal Reserve is highly likely to begin raising interest rates in September.
The Federal Reserve signaled a hawkish stance at its policy meeting last week, suggesting further tightening of monetary policy this year. Fed Chairman Kevin Warsh reiterated the central bank's determination to bring inflation back to its 2% target, significantly strengthening market expectations for interest rate hikes and providing strong support for the continued strength of the US dollar. This, coupled with across-the-board positive US Purchasing Managers' Index (PMI) data for June—the S&P Global Services PMI rising to 51.3 from 50.7 in May and the Manufacturing PMI climbing to 55.7 from 55.1—both exceeding market expectations, confirmed the resilience of the US economy and further solidified the foundation for the Fed to tighten monetary policy.
Market expectations have been slightly adjusted. The CME FedWatch Tool shows that the market is pricing in a 70% probability of a Fed rate hike in September (previously the market forecast was 90%). At the same time, the market still expects the Fed to raise rates again next year. The focus of the market has shifted to this week's US personal consumption expenditure (PCE) inflation data and the final value of first-quarter GDP, which will further guide the Fed's subsequent policy path.
From real-time market trends and technical indicators, the overall downtrend in gold is very clear. Gold prices continued to decline on Tuesday, briefly falling below the $4100 mark during the session, and are currently trading around $4130, generally fluctuating weakly at low levels. The strengthening US dollar is the core factor suppressing gold prices. The US dollar index (DXY) is currently holding steady around 101.35, reaching a one-year high since May 2025. Coupled with rising US Treasury yields, this has completely reversed the two-year gold bull market driven by geopolitical conflicts, central bank gold purchases, and Fed rate cuts. Currently, gold prices have plummeted nearly 25% from their historical high of $5600 in January of this year, entering a deep correction cycle.
Technical Analysis
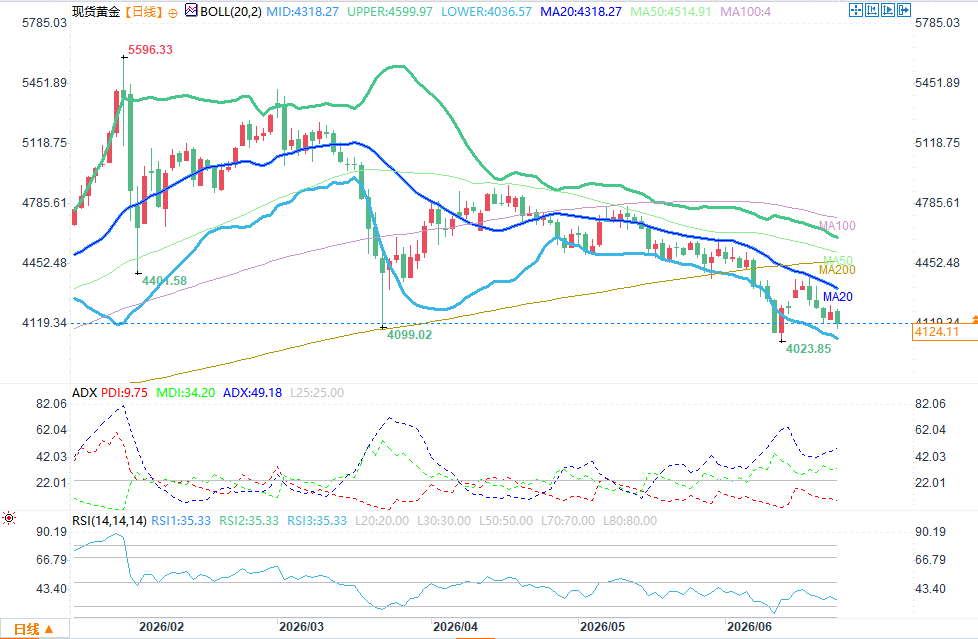
(Spot gold daily chart source: FX678)
From a technical perspective, gold prices continue to trade below the 20-day Bollinger Band moving average ($4318.27), firmly suppressed by this key moving average, indicating a complete downtrend. Currently, gold prices are gradually approaching the key support level of the lower Bollinger Band at $4037. The daily 14-day Relative Strength Index (RSI) remains in the middle of the 30 range around 35, not yet entering the extreme oversold reversal zone, meaning that downward selling pressure has not yet been fully released, and there is no clear signal of a bottom. Meanwhile, the Average Directional Movement Index (ADX) has risen to around 49, directly reflecting the strong downward momentum, and the MACD indicator also continues to release bearish signals. The convergence of multiple technical indicators confirms that short-term selling pressure will continue.
On the reverse trend breakout side, the primary key resistance level on the daily chart is around $4318, the 20-day Bollinger Band moving average, which is also the first strong resistance level for a short-term bullish rebound. If an oversold rebound occurs subsequently, the next resistance level to watch is the upper Bollinger Band around $4600. Only if gold prices effectively break through the key resistance zone of $4330 can the current continuous downward trend be initially reversed.
From a long-term trend and low-level support perspective, the World Gold Council's latest weekly market monitoring report gives a clear prediction: if the US dollar index continues to hold above the 100 mark, the downward trend in gold will continue further, and it is highly likely to break through the psychological level of $4,000. The next key support level is the $3,887-$3,857 range (corresponding to the 38.2% Fibonacci retracement level of the current gold rally, a potential key bottoming zone); if bearish momentum continues and the market weakens further, the next major support level will be around $3,500, the high point of October 2025.
In terms of geopolitical situation, the US-Iran conflict has become a secondary factor affecting market sentiment. Last week, the US and Iran signed a 60-day memorandum of understanding to begin negotiations, with the US temporarily easing sanctions on Iranian oil exports. This has temporarily eased geopolitical tensions in the Middle East and mitigated the impact of inflation, indirectly negatively impacting gold's safe-haven appeal. However, many core differences remain in the negotiations, with key issues such as the Iranian nuclear issue and security in the Lebanon region remaining unresolved. The situation may continue to fluctuate, requiring close monitoring of developments.
Trading Operation Recommendations
The current market is highly uncertain. The Fed's high interest rate expectations and a strong dollar are the core negative factors suppressing gold prices. Until there is a substantial shift in the Fed's hawkish stance, gold prices are unlikely to see a sustained rebound, and the weak, downward trend is expected to continue. Traders are advised to first observe market dynamics to confirm whether the selling pressure continues, paying close attention to the market volatility brought about by this week's core US PCE inflation and GDP data. Avoid blindly buying the dip. Strictly adhere to support and resistance levels in trading, strictly control position size, implement stop-loss orders, and mitigate the risks of sudden fluctuations caused by geopolitical tensions and data releases.
The gold market is currently facing multiple short-term negative factors, including expectations of a Federal Reserve rate hike, a strong appreciation of the US dollar, and weak inflows of investment funds into the market. Several authoritative institutions have updated their market forecasts; Deutsche Bank and Bank of America Global Research have both revised their outlook reports, confirming that the Federal Reserve is highly likely to begin raising interest rates in September.
The Federal Reserve signaled a hawkish stance at its policy meeting last week, suggesting further tightening of monetary policy this year. Fed Chairman Kevin Warsh reiterated the central bank's determination to bring inflation back to its 2% target, significantly strengthening market expectations for interest rate hikes and providing strong support for the continued strength of the US dollar. This, coupled with across-the-board positive US Purchasing Managers' Index (PMI) data for June—the S&P Global Services PMI rising to 51.3 from 50.7 in May and the Manufacturing PMI climbing to 55.7 from 55.1—both exceeding market expectations, confirmed the resilience of the US economy and further solidified the foundation for the Fed to tighten monetary policy.
Market expectations have been slightly adjusted. The CME FedWatch Tool shows that the market is pricing in a 70% probability of a Fed rate hike in September (previously the market forecast was 90%). At the same time, the market still expects the Fed to raise rates again next year. The focus of the market has shifted to this week's US personal consumption expenditure (PCE) inflation data and the final value of first-quarter GDP, which will further guide the Fed's subsequent policy path.
From real-time market trends and technical indicators, the overall downtrend in gold is very clear. Gold prices continued to decline on Tuesday, briefly falling below the $4100 mark during the session, and are currently trading around $4130, generally fluctuating weakly at low levels. The strengthening US dollar is the core factor suppressing gold prices. The US dollar index (DXY) is currently holding steady around 101.35, reaching a one-year high since May 2025. Coupled with rising US Treasury yields, this has completely reversed the two-year gold bull market driven by geopolitical conflicts, central bank gold purchases, and Fed rate cuts. Currently, gold prices have plummeted nearly 25% from their historical high of $5600 in January of this year, entering a deep correction cycle.
Technical Analysis
(Spot gold daily chart source: FX678)
From a technical perspective, gold prices continue to trade below the 20-day Bollinger Band moving average ($4318.27), firmly suppressed by this key moving average, indicating a complete downtrend. Currently, gold prices are gradually approaching the key support level of the lower Bollinger Band at $4037. The daily 14-day Relative Strength Index (RSI) remains in the middle of the 30 range around 35, not yet entering the extreme oversold reversal zone, meaning that downward selling pressure has not yet been fully released, and there is no clear signal of a bottom. Meanwhile, the Average Directional Movement Index (ADX) has risen to around 49, directly reflecting the strong downward momentum, and the MACD indicator also continues to release bearish signals. The convergence of multiple technical indicators confirms that short-term selling pressure will continue.
On the reverse trend breakout side, the primary key resistance level on the daily chart is around $4318, the 20-day Bollinger Band moving average, which is also the first strong resistance level for a short-term bullish rebound. If an oversold rebound occurs subsequently, the next resistance level to watch is the upper Bollinger Band around $4600. Only if gold prices effectively break through the key resistance zone of $4330 can the current continuous downward trend be initially reversed.
From a long-term trend and low-level support perspective, the World Gold Council's latest weekly market monitoring report gives a clear prediction: if the US dollar index continues to hold above the 100 mark, the downward trend in gold will continue further, and it is highly likely to break through the psychological level of $4,000. The next key support level is the $3,887-$3,857 range (corresponding to the 38.2% Fibonacci retracement level of the current gold rally, a potential key bottoming zone); if bearish momentum continues and the market weakens further, the next major support level will be around $3,500, the high point of October 2025.
In terms of geopolitical situation, the US-Iran conflict has become a secondary factor affecting market sentiment. Last week, the US and Iran signed a 60-day memorandum of understanding to begin negotiations, with the US temporarily easing sanctions on Iranian oil exports. This has temporarily eased geopolitical tensions in the Middle East and mitigated the impact of inflation, indirectly negatively impacting gold's safe-haven appeal. However, many core differences remain in the negotiations, with key issues such as the Iranian nuclear issue and security in the Lebanon region remaining unresolved. The situation may continue to fluctuate, requiring close monitoring of developments.
Trading Operation Recommendations
The current market is highly uncertain. The Fed's high interest rate expectations and a strong dollar are the core negative factors suppressing gold prices. Until there is a substantial shift in the Fed's hawkish stance, gold prices are unlikely to see a sustained rebound, and the weak, downward trend is expected to continue. Traders are advised to first observe market dynamics to confirm whether the selling pressure continues, paying close attention to the market volatility brought about by this week's core US PCE inflation and GDP data. Avoid blindly buying the dip. Strictly adhere to support and resistance levels in trading, strictly control position size, implement stop-loss orders, and mitigate the risks of sudden fluctuations caused by geopolitical tensions and data releases.
- Risk Warning and Disclaimer
- The market involves risk, and trading may not be suitable for all investors. This article is for reference only and does not constitute personal investment advice, nor does it take into account certain users’ specific investment objectives, financial situation, or other needs. Any investment decisions made based on this information are at your own risk.