


Behind the Australian dollar's "Black Tuesday" lies a triple negative factor.
2026-06-24 09:22:05
On Wednesday (June 24) in early Asian trading, the Australian dollar traded in a narrow range against the US dollar, currently around 0.6915.
The Australian dollar plunged more than 1.20% against the US dollar on Tuesday, falling from an intraday high of 0.7003 to 0.6915.
Global stock markets plummeted as the valuation bubble in artificial intelligence stocks burst, prompting a surge of safe-haven funds into the US dollar. Meanwhile, market expectations for further interest rate hikes by the Federal Reserve intensified, creating a double blow to the Australian dollar.

Global stock markets suffered a sharp decline on Tuesday as investors concentrated their selling on overvalued tech stocks, particularly those related to artificial intelligence. South Korea's KOSPI tech index plunged more than 10%, and the Nasdaq fell by over 3%. Market panic quickly spread to the foreign exchange market, with the US dollar becoming the biggest winner of the day; the US dollar index (DXY) rose 0.37% to close at 101.37.
The market's risk aversion logic lies in the fact that the stock market crash prompted funds to seek safe-haven assets, and the US dollar, as the world's primary reserve currency and safe-haven tool, naturally became sought after. At the same time, market expectations for further tightening of monetary policy by the Federal Reserve continued to rise, with the money market already pricing in a Fed rate hike of approximately 34 basis points in 2026, further solidifying the dollar's attractiveness.
The latest U.S. economic data shows that business activity maintained healthy expansion in both the manufacturing and service sectors in June, further validating the narrative of the U.S. economy's "exceptionalism" relative to other major economies. This data provides solid fundamental support for the U.S. dollar.
On the economic data front, Australia is about to release its May Consumer Price Index (CPI) report. The market expects the month-on-month change to fall to -0.3% from 0.4%, while the core CPI is expected to remain flat at 0.3%. Year-on-year, the overall CPI is expected to rise to 4.4% from 4.2%, while the core CPI is expected to rise slightly to 3.5%. This data could reshape market expectations for further tightening of policy by the Reserve Bank of Australia (RBA)—notably, the RBA is the only developed economy central bank to reverse its easing cycle and cumulatively raise interest rates by 75 basis points by 2026.
In the US, this week is packed with economic data: Wednesday will see the release of the preliminary S&P Global Purchasing Managers Index (PMI) and housing data; Thursday will bring the final Q1 GDP figure, the Fed's preferred inflation gauge—the core personal consumption expenditures (PCE) price index—and initial jobless claims. These data will provide the market with key clues about the Fed's next policy path.
According to Iran's ambassador to the United Nations, progress has been made in negotiations between the US and Iran. If a final solution is reached, it could push international oil prices back to pre-war levels, thereby easing global inflationary pressures. This prospect would help lower bond yields in G8 economies and potentially reduce the need for major central banks to further tighten monetary policy.
Lower oil prices have a dual impact on Australia: on the one hand, lower energy costs help alleviate global inflationary pressures and benefit the economies of its trading partners; on the other hand, as a major commodity exporter, falling oil prices may drag down Australia's export revenue, indirectly putting pressure on the Australian dollar.
Goldman Sachs believes that demand for the US dollar will weaken in 2026 due to declining attractiveness of US assets, providing support for commodity currencies. Regarding the Australian dollar against the US dollar, Goldman Sachs believes that the Australian dollar, as a high-yield commodity currency, will benefit from robust global economic growth (projected at 2.8%), a recovery in commodity prices (especially demand for copper and iron ore related to AI), and stable growth in China following the easing of US-China trade tensions.
Goldman Sachs points out that the RBA's policy stance is relatively hawkish, while the Federal Reserve is likely to continue its accommodative path due to a weak labor market, further widening the interest rate differential between the two countries. In the short term, the Australian dollar may face volatility, but the overall trend is bullish, with AUD/USD expected to gradually rise to the 0.70-0.73 range by 2026.
Morgan Stanley views the Australian dollar as one of the cleanest long targets in a weak US dollar environment in 2026, expecting AUD/USD to rise by about 8% to around 0.7000 in the coming quarters.
The agency emphasized Australia's strong domestic fundamentals, including robust economic growth, a vibrant housing market, high immigration levels, and supportive commodity prices, all of which underpin the Australian dollar's appreciation. The policy divergence between the RBA and the Federal Reserve is a key driver: the RBA is likely to maintain higher interest rates, while the Federal Reserve continues its easing policy due to labor market concerns, widening the interest rate differential is beneficial to the Australian dollar.
From the daily chart, the short-term bearish forces are currently in control. The moving average system is in a bearish alignment, and the price has effectively broken below the short- and medium-term moving averages of MA20 (0.6698) and MA50 (0.6616). Only the MA200 (0.6532) below provides long-term support. The moving averages are exerting significant downward pressure, and there is substantial resistance to any upward movement.
The MACD indicator DIFF (0.0023) has slightly crossed below DEA (0.0026), and the histogram has turned negative, indicating that the bearish momentum is gradually being released and the downtrend is confirmed. The RSI indicator continues to decline, far from the neutral range, and no oversold signal has appeared, indicating that the downside potential has not yet been fully released.
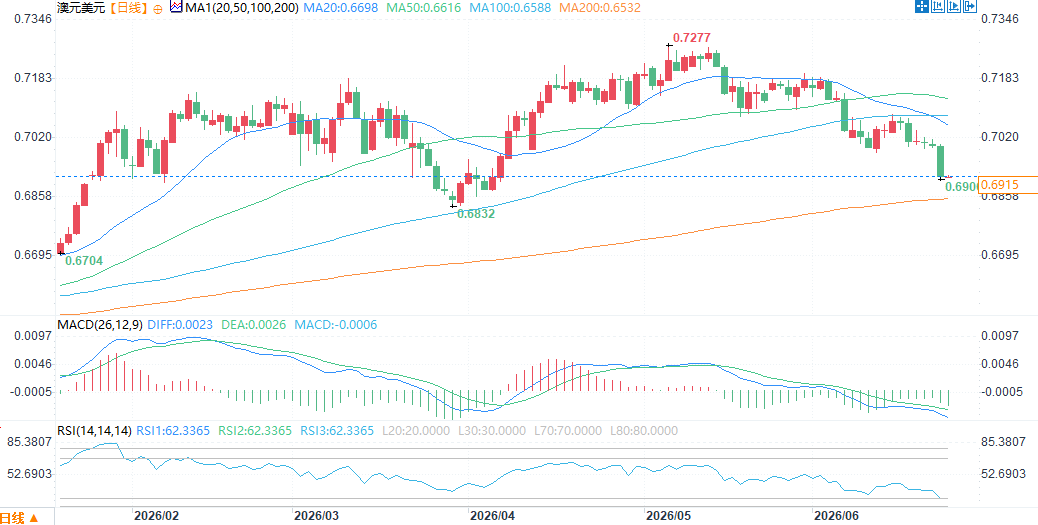
(AUD/USD daily chart, source: FX678)
At 9:21 AM Beijing time on June 24, the Australian dollar was trading at 0.6912/13 against the US dollar.
The Australian dollar plunged more than 1.20% against the US dollar on Tuesday, falling from an intraday high of 0.7003 to 0.6915.
Global stock markets plummeted as the valuation bubble in artificial intelligence stocks burst, prompting a surge of safe-haven funds into the US dollar. Meanwhile, market expectations for further interest rate hikes by the Federal Reserve intensified, creating a double blow to the Australian dollar.
The collapse of the AI sector triggered a global wave of risk aversion.
Global stock markets suffered a sharp decline on Tuesday as investors concentrated their selling on overvalued tech stocks, particularly those related to artificial intelligence. South Korea's KOSPI tech index plunged more than 10%, and the Nasdaq fell by over 3%. Market panic quickly spread to the foreign exchange market, with the US dollar becoming the biggest winner of the day; the US dollar index (DXY) rose 0.37% to close at 101.37.
The market's risk aversion logic lies in the fact that the stock market crash prompted funds to seek safe-haven assets, and the US dollar, as the world's primary reserve currency and safe-haven tool, naturally became sought after. At the same time, market expectations for further tightening of monetary policy by the Federal Reserve continued to rise, with the money market already pricing in a Fed rate hike of approximately 34 basis points in 2026, further solidifying the dollar's attractiveness.
US economic data highlights the advantage of "exceptionalism".
The latest U.S. economic data shows that business activity maintained healthy expansion in both the manufacturing and service sectors in June, further validating the narrative of the U.S. economy's "exceptionalism" relative to other major economies. This data provides solid fundamental support for the U.S. dollar.
On the economic data front, Australia is about to release its May Consumer Price Index (CPI) report. The market expects the month-on-month change to fall to -0.3% from 0.4%, while the core CPI is expected to remain flat at 0.3%. Year-on-year, the overall CPI is expected to rise to 4.4% from 4.2%, while the core CPI is expected to rise slightly to 3.5%. This data could reshape market expectations for further tightening of policy by the Reserve Bank of Australia (RBA)—notably, the RBA is the only developed economy central bank to reverse its easing cycle and cumulatively raise interest rates by 75 basis points by 2026.
In the US, this week is packed with economic data: Wednesday will see the release of the preliminary S&P Global Purchasing Managers Index (PMI) and housing data; Thursday will bring the final Q1 GDP figure, the Fed's preferred inflation gauge—the core personal consumption expenditures (PCE) price index—and initial jobless claims. These data will provide the market with key clues about the Fed's next policy path.
Easing geopolitical tensions: Progress in US-Iran negotiations boosts market sentiment
According to Iran's ambassador to the United Nations, progress has been made in negotiations between the US and Iran. If a final solution is reached, it could push international oil prices back to pre-war levels, thereby easing global inflationary pressures. This prospect would help lower bond yields in G8 economies and potentially reduce the need for major central banks to further tighten monetary policy.
Lower oil prices have a dual impact on Australia: on the one hand, lower energy costs help alleviate global inflationary pressures and benefit the economies of its trading partners; on the other hand, as a major commodity exporter, falling oil prices may drag down Australia's export revenue, indirectly putting pressure on the Australian dollar.
Institutional Views
Goldman Sachs believes that demand for the US dollar will weaken in 2026 due to declining attractiveness of US assets, providing support for commodity currencies. Regarding the Australian dollar against the US dollar, Goldman Sachs believes that the Australian dollar, as a high-yield commodity currency, will benefit from robust global economic growth (projected at 2.8%), a recovery in commodity prices (especially demand for copper and iron ore related to AI), and stable growth in China following the easing of US-China trade tensions.
Goldman Sachs points out that the RBA's policy stance is relatively hawkish, while the Federal Reserve is likely to continue its accommodative path due to a weak labor market, further widening the interest rate differential between the two countries. In the short term, the Australian dollar may face volatility, but the overall trend is bullish, with AUD/USD expected to gradually rise to the 0.70-0.73 range by 2026.
Morgan Stanley views the Australian dollar as one of the cleanest long targets in a weak US dollar environment in 2026, expecting AUD/USD to rise by about 8% to around 0.7000 in the coming quarters.
The agency emphasized Australia's strong domestic fundamentals, including robust economic growth, a vibrant housing market, high immigration levels, and supportive commodity prices, all of which underpin the Australian dollar's appreciation. The policy divergence between the RBA and the Federal Reserve is a key driver: the RBA is likely to maintain higher interest rates, while the Federal Reserve continues its easing policy due to labor market concerns, widening the interest rate differential is beneficial to the Australian dollar.
Technical Analysis
From the daily chart, the short-term bearish forces are currently in control. The moving average system is in a bearish alignment, and the price has effectively broken below the short- and medium-term moving averages of MA20 (0.6698) and MA50 (0.6616). Only the MA200 (0.6532) below provides long-term support. The moving averages are exerting significant downward pressure, and there is substantial resistance to any upward movement.
The MACD indicator DIFF (0.0023) has slightly crossed below DEA (0.0026), and the histogram has turned negative, indicating that the bearish momentum is gradually being released and the downtrend is confirmed. The RSI indicator continues to decline, far from the neutral range, and no oversold signal has appeared, indicating that the downside potential has not yet been fully released.
(AUD/USD daily chart, source: FX678)
At 9:21 AM Beijing time on June 24, the Australian dollar was trading at 0.6912/13 against the US dollar.
- Risk Warning and Disclaimer
- The market involves risk, and trading may not be suitable for all investors. This article is for reference only and does not constitute personal investment advice, nor does it take into account certain users’ specific investment objectives, financial situation, or other needs. Any investment decisions made based on this information are at your own risk.
