Iran's move to control the Straits of Hormuz signals a reassessment of rules for the energy market.
2026-06-30 16:00:05
On Tuesday, June 30, the Strait of Hormuz once again became a pricing center in the energy market. Iran's Deputy Foreign Minister stated that Iran hopes to jointly manage ship passage through the strait with Oman, and if Oman does not participate, Iran will proceed with its own arrangements. The US stated that related negotiations will take place in Doha, but Iranian officials indicated they would not meet directly with US officials.
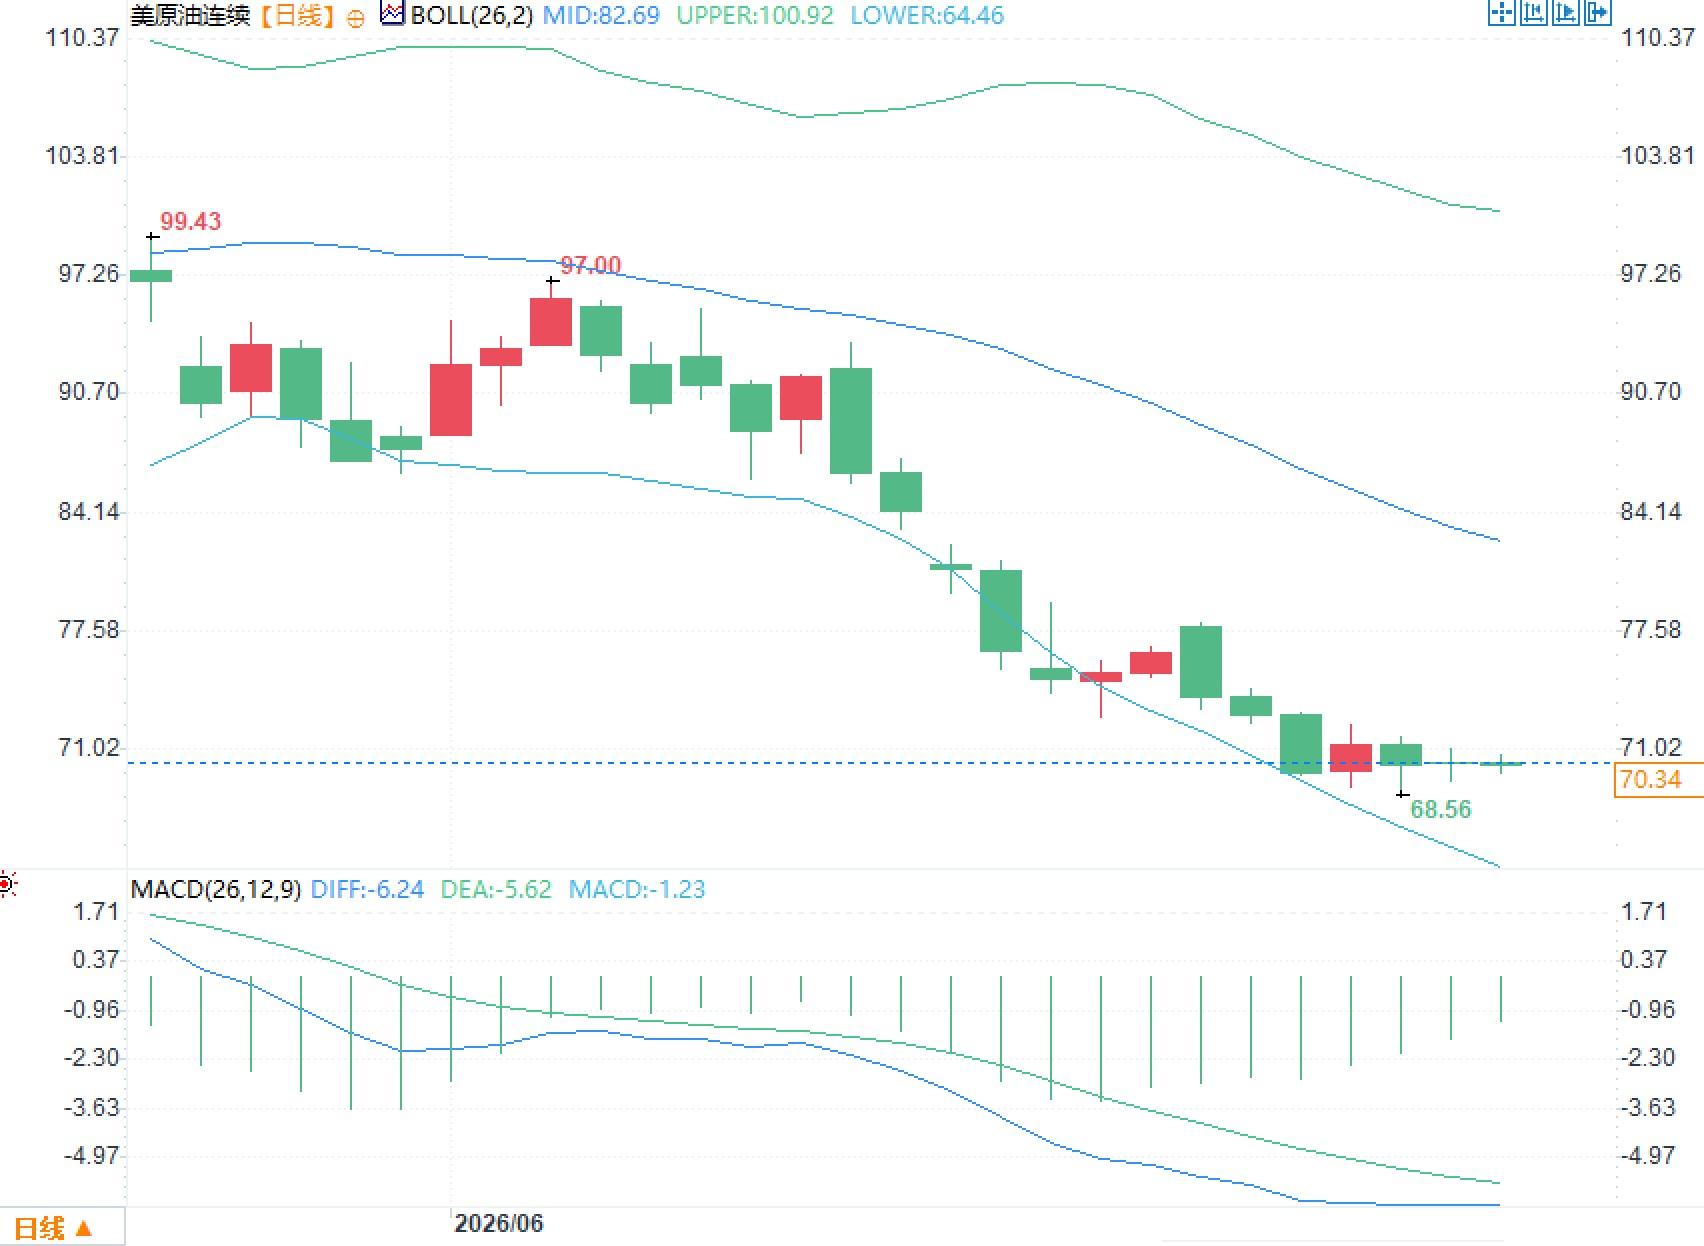
This means the market is no longer facing a premium for a single conflict, but rather a repricing of shipping rules, cost structures, insurance costs, and energy basis. On June 30th, Brent crude was around $73 per barrel and WTI crude was around $70 per barrel, a significant drop from previous highs, but the risk discount to changes in the Straits Exchange Foundation's rules has not yet been eliminated.
The core variable in the Strait of Hormuz is not whether passage will be completely interrupted, but whether passage can continue to operate according to existing international shipping practices. If so-called service fees, pilotage fees, environmental fees, or other charges are introduced in the future, tanker costs will shift from a one-time risk shock to sustainable frictional costs, directly affecting spot premiums and discounts, forward curves, and refinery purchasing pace.
The US president recently stated that the Doha meeting "may be important, or may not be important," focusing on the Iranian nuclear issue. The market implication of this statement is that the negotiation objectives are not entirely equivalent to restoring normal shipping operations. Even if the ceasefire framework continues, if the rights to manage the Straits, toll collection, and the vessel identification mechanism remain unclear, risk premiums will still remain in more nuanced ways in freight rates, insurance, basis, and option volatility.
Brent crude returned to around $73, indicating that traders have reduced some of the pricing in extreme supply disruptions, but the price pullback does not equate to a complete supply chain recovery. The latest energy report shows that global oil demand is projected to decline by 1.1 million barrels per day year-on-year in 2026, while global supply is expected to fall to 102.4 million barrels per day; global production in May was 94.5 million barrels per day, 13.6 million barrels per day lower than before the conflict. During the same period, global observable oil inventories decreased by 143 million barrels in May, with an average destocking rate of 3.8 million barrels per day since the conflict began.
This data explains the current price paradox: weak demand is suppressing the upper limit of oil prices, while inventory depletion and supply uncertainty in the Gulf are supporting the lower limit. For traders, the key is not simply judging the strength or weakness of oil prices, but rather identifying the market's shift from "supply gap trading" to "rule uncertainty trading." Once the fee mechanism is discussed and finalized, Brent crude and Middle Eastern benchmarks, light-heavy price spreads, and refined product crack spreads may all be more sensitive than the crude oil price alone.
The Strait of Hormuz's impact extends beyond crude oil. Official energy data estimates that in 2024, the average daily oil flow through the strait was 20 million barrels, accounting for approximately 20% of global liquid oil consumption and over a quarter of global seaborne oil trade; meanwhile, about one-fifth of global LNG trade also passes through this passage.
LNG is more vulnerable. Energy data shows that nearly 90% of LNG exported through this strait will reach Asian markets by 2025. If the passage is disrupted, global LNG supply could decrease by more than 300 million cubic meters per day, approaching 20% of global supply. This would put pressure on electricity, fertilizer, shipping fuel, and manufacturing costs. In other words, the apparent decline in oil prices may mask the tail risks in gas prices, freight rates, and insurance premiums.
If the US-Iran temporary arrangement only covers 60 days, the market will naturally focus on the institutional arrangements after its expiration. In the short term, tankers are still attempting to resume passage, with some ships re-entering or leaving the strait, indicating that physical flows have not been completely frozen. However, as long as the rules regarding fees, pilotage, ship inspections, and third-party escort are not clearly defined, traders, refineries, and shipowners will tend to increase their risk budgets.
Next, we need to focus on three types of variables: First, whether Oman explicitly rejects or accepts a joint administration arrangement; second, whether any fee structure is packaged as environmental, navigation, or security services; and third, whether major energy importers diversify risk through long-term contracts, inventory releases, or alternative shipping routes. If the negotiations only resolve military de-escalation but not the rules for passage through the Straits, oil prices may continue to exhibit structural fluctuations, suppressed by demand on the upside and supported by geopolitical factors on the downside.
- Risk Warning and Disclaimer
- The market involves risk, and trading may not be suitable for all investors. This article is for reference only and does not constitute personal investment advice, nor does it take into account certain users’ specific investment objectives, financial situation, or other needs. Any investment decisions made based on this information are at your own risk.